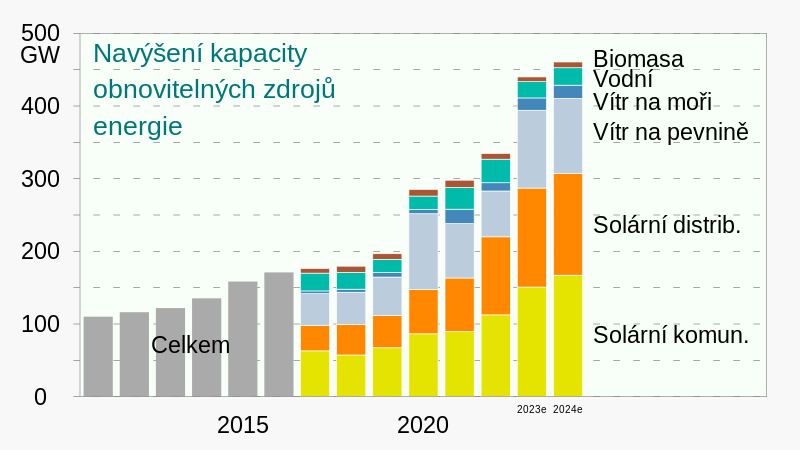
File:2011- Renewable energy capacity - International Energy Agency-cs.svg


From Wikimedia Commons, the free media repository


Jump to navigation  Jump to search  
File

File history

File usage on Commons

File usage on other wikis

Metadata
File:2011- Renewable energy capacity - International Energy Agency-cs.svg
Size of this PNG preview of this SVG file: 800 × 450 pixels. Other resolutions: 320 × 180 pixels | 640 × 360 pixels | 1,024 × 576 pixels | 1,280 × 720 pixels | 2,560 × 1,440 pixels | 1,200 × 675 pixels.

Original file(SVG file, nominally 1,200 × 675 pixels, file size: 4 KB)

File information
Structured data

Captions

Captions


Add a one-line explanation of what this file represents

2011- Renewable energy capacity - International Energy Agency-cs

Summary

[edit]
Description
English: Bar chart (column graph) of the number of gigawatts of w:renewable energy capacity (2011- ), as reported by the w:International Energy Agency.
  • Archive thereof: https://web.archive.org/web/20210511221837/https://www.iea.org/reports/renewable-energy-market-update-2021/renewable-electricity
  • Quote from source: "Despite pandemic-induced supply chain challenges and construction delays, renewable capacity additions in 2020 expanded by more than 45% from 2019, and broke another record. An exceptional 90% rise in global wind capacity additions led the expansion. Also underpinning this record growth was the 23% expansion of new solar PV installations to almost 135 GW in 2020. * * * * * * The exceptional level of renewable energy capacity additions is expected to be maintained, with 270 GW becoming operational in 2021 and 280 GW in 2022. This expansion exceeds the record-level annual capacity additions of 2017-2019 by over 50%, such that renewables are expected to account for 90% of total global power capacity increases in both 2021 and 2022."
    • XML code for graph was originally generated by the Column Graph spreadsheet linked below. Minor changes were made manually, to reduce file size and to get text positioned "just right".
    General concept above; examples below.
    Warming stripes
    (five examples compared)
    Warming stripes bar chart
    Bar chart (vertical)
    Pie chart
    Line charts
    Scatterplot

    I've uploaded .xlsx (Microsoft Excel) spreadsheets that automatically generate XML code for charts in SVG format.

    You simply paste or enter your data into the spreadsheet, and specify image dimensions, number of grid lines, font sizes, etc. The spreadsheet instantly and automatically generates a column of XML code that you simply copy and paste into a text editor and save as an ".svg" file. The spreadsheets produce lean SVG code, avoiding the "extra stuff" that Inkscape inserts. They should save you time in creating SVG charts.

    Feedback and suggestions on my talk page are welcome. RCraig09 (talk) 23:41, 19 February 2021 (UTC)

    Click HOW TO for detailed explanation.
    Click HERE (else HERE) to download the spreadsheets.
    1. Warming stripes — Accepts a single dataset and converts to SVG code portraying Ed Hawkins' warming stripes graphics. User chooses vertical or horizontal stripes; normal or reverse data ordering; or from a variety of geometric shapes (updated 17 May 2023). . . . . Click here to see examples of warming stripes embedded in different shapes.
    2. Warming stripes bar chart — Accepts a single dataset and creates a conventional bar chart whose individual bars/columns are coloured according to Dr. Hawkins' warming stripes colour scheme. Alternate option: choose one colour for ascending bars and another colour for descending bars. (updated 28 August 2023)
    3. Line charts — Accepts up to six datasets. (updated 30 August 2023)
    4. Vertical bar charts (column charts) — Accepts up to six datasets. Toggle between clustered and stacked charts; user can adjust "Yfloor"—the Y level (usually=0) from which columns rise or fall; user chooses to keep or ignore negative input values. (updated 27 August 2023)
    5. Horizontal bar charts — Accepts up to six datasets. Toggle between clustered and stacked charts; user can adjust "Yfloor"—the value (usually=0) from which bars extend; user chooses to keep or ignore negative input values. (updated 27 August 2023)
    6. Scatter plots — Accepts up to five datasets. (updated 28 August 2023)
    7. Pie charts — Accepts a single dataset of up to 36 items. (updated 17 May 2023)
    8. Variable-width bar charts — Accepts up to six datasets; is like "Vertical bar charts", above, but user can choose different widths for different bars. (updated 27 August 2023)

    Čeština: Sloupcový graf počtu gigawattů kapacity w:obnovitelná energie (2011– ) podle údajů Mezinárodní energetické agentury.
    Date
    Source Own work
    Author RCraig09, Czech translation Jirka Dl
    Other versions

    Licensing

    [edit]
    I, the copyright holder of this work, hereby publish it under the following license:
    w:en:Creative Commons
    attribution share alike
    This file is licensed under the Creative Commons Attribution-Share Alike 4.0 International license.
    You are free:
    • to share – to copy, distribute and transmit the work
  • to remix – to adapt the work
  • Under the following conditions:

    File history


    Click on a date/time to view the file as it appeared at that time.
    Date/TimeThumbnailDimensionsUserComment
    current10:35, 29 September 2023Thumbnail for version as of 10:35, 29 September 20231,200 × 675 (4 KB)Jirka Dl (talk | contribs)Update according to ed source
    20:59, 12 January 2022Thumbnail for version as of 20:59, 12 January 20221,063 × 750 (9 KB)Pavouk (talk | contribs)hydro >vodní; labels in lowercase letters
    13:50, 4 January 2022Thumbnail for version as of 13:50, 4 January 20221,063 × 750 (8 KB)Jirka Dl (talk | contribs)Uploaded own work with UploadWizard


    You cannot overwrite this file.


    The following 3 pages use this file:

    User:Paris 16/Recent uploads/2022 January 11-13

    File:2011- Renewable energy capacity - International Energy Agency.svg

    File:2011- Renewable energy capacity - International Energy Agency cs.svg (file redirect) 


    File usage on other wikis


    The following other wikis use this file:

    Usage on cs.wikipedia.org

    Obnovitelná energie


    Metadata

    This file contains additional information such as Exif metadata which may have been added by the digital camera, scanner, or software program used to create or digitize it. If the file has been modified from its original state, some details such as the timestamp may not fully reflect those of the original file. The timestamp is only as accurate as the clock in the camera, and it may be completely wrong.

    Structured data

    Items portrayed in this file

    depicts

    copyright status

    copyrighted

    copyright license

    Creative Commons Attribution-ShareAlike 4.0 International

    source of file

    original creation by uploader

    inception

    11 May 2021

    media type

    image/svg+xml

    checksum

    fc137dc23fc996cfb9fca68c97cb23a74a5fa156

    determination method: SHA-1

    data size

    8,739 byte

    height

    750 pixel

    width

    1,063 pixel


    Retrieved from "https://commons.wikimedia.org/w/index.php?title=File:2011-_Renewable_energy_capacity_-_International_Energy_Agency-cs.svg&oldid=806203510"

    Categories: 
    Renewable energy statistics
    International Energy Agency
    SVG bar charts
    SVG diagrams created with spreadsheet
    Hidden categories: 
    Pages using multiple image with auto scaled images
    CC-BY-SA-4.0
    Self-published work


    Navigation menu


    Personal tools  


    English
    Not logged in
    Talk
    Contributions
    Create account
    Log in


    Namespaces  


    File
    Discussion