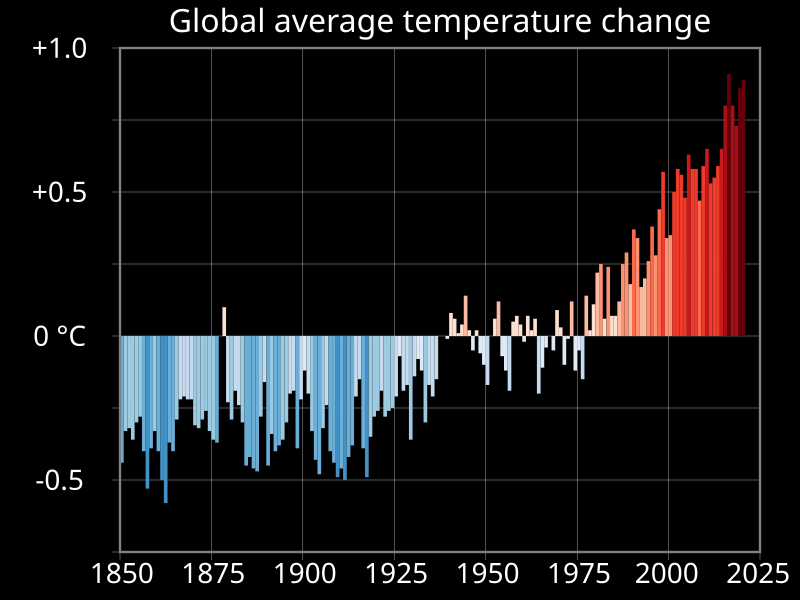
File:20210822 Global warming - warming stripes bar chart.svg


From Wikimedia Commons, the free media repository


Jump to navigation  Jump to search  
File

File history

File usage on Commons

File usage on other wikis

Metadata
File:20210822 Global warming - warming stripes bar chart.svg
Size of this PNG preview of this SVG file: 800 × 600 pixels. Other resolutions: 320 × 240 pixels | 640 × 480 pixels | 1,024 × 768 pixels | 1,280 × 960 pixels | 2,560 × 1,920 pixels | 1,000 × 750 pixels.

Original file(SVG file, nominally 1,000 × 750 pixels, file size: 14 KB)

Render this image in .
File information
Structured data

Captions

Captions


Vertical bar chart showing global average temperature change, with each bar/column being coloured according to the warming stripes colouring scheme of climatologist Ed Hawkins

Summary

[edit]
Description
English: Vertical bar chart showing global average temperature change, with each bar/column being coloured according to the Warming stripes colouring scheme of Ed Hawkins (climatologist, who conceived the idea of warming stripes.
  • Similar charts in PNG format are available from Dr. Hawkins' website https://showyourstripes.info/ (Creative Commons licensed CC by 4.0)
  • Almost all the SVG code was generated by the "Warming stripes bar chart" spreadsheet linked below.
  • General concept above; examples below.
    Warming stripes
    (five examples compared)
    Warming stripes bar chart
    Bar chart (vertical)
    Pie chart
    Line charts
    Scatterplot

    I've uploaded .xlsx (Microsoft Excel) spreadsheets that automatically generate XML code for charts in SVG format.

    You simply paste or enter your data into the spreadsheet, and specify image dimensions, number of grid lines, font sizes, etc. The spreadsheet instantly and automatically generates a column of XML code that you simply copy and paste into a text editor and save as an ".svg" file. The spreadsheets produce lean SVG code, avoiding the "extra stuff" that Inkscape inserts. They should save you time in creating SVG charts.

    Feedback and suggestions on my talk page are welcome. RCraig09 (talk) 23:41, 19 February 2021 (UTC)

    Click HOW TO for detailed explanation.
    Click HERE (else HERE) to download the spreadsheets.
    1. Warming stripes — Accepts a single dataset and converts to SVG code portraying Ed Hawkins' warming stripes graphics. User chooses vertical or horizontal stripes; normal or reverse data ordering; or from a variety of geometric shapes (updated 17 May 2023). . . . . Click here to see examples of warming stripes embedded in different shapes.
    2. Warming stripes bar chart — Accepts a single dataset and creates a conventional bar chart whose individual bars/columns are coloured according to Dr. Hawkins' warming stripes colour scheme. Alternate option: choose one colour for ascending bars and another colour for descending bars. (updated 28 August 2023)
    3. Line charts — Accepts up to six datasets. (updated 30 August 2023)
    4. Vertical bar charts (column charts) — Accepts up to six datasets. Toggle between clustered and stacked charts; user can adjust "Yfloor"—the Y level (usually=0) from which columns rise or fall; user chooses to keep or ignore negative input values. (updated 27 August 2023)
    5. Horizontal bar charts — Accepts up to six datasets. Toggle between clustered and stacked charts; user can adjust "Yfloor"—the value (usually=0) from which bars extend; user chooses to keep or ignore negative input values. (updated 27 August 2023)
    6. Scatter plots — Accepts up to five datasets. (updated 28 August 2023)
    7. Pie charts — Accepts a single dataset of up to 36 items. (updated 17 May 2023)
    8. Variable-width bar charts — Accepts up to six datasets; is like "Vertical bar charts", above, but user can choose different widths for different bars. (updated 27 August 2023)

    Date
    Source Own work
    Author RCraig09
    SVG development

    InfoField

     
    The SVG code is valid.
     
    This chart was created with an unknown SVG tool.
     
     This chart uses embedded text that can be easily translated using a text editor.

    Licensing

    [edit]
    I, the copyright holder of this work, hereby publish it under the following license:
    w:en:Creative Commons
    attribution share alike
    This file is licensed under the Creative Commons Attribution-Share Alike 4.0 International license.
    You are free:
    • to share – to copy, distribute and transmit the work
  • to remix – to adapt the work
  • Under the following conditions:

    File history


    Click on a date/time to view the file as it appeared at that time.
    Date/TimeThumbnailDimensionsUserComment
    current20:41, 8 August 2022Thumbnail for version as of 20:41, 8 August 20221,000 × 750 (14 KB)Sebastian Wallroth (talk | contribs)File uploaded using svgtranslate tool (https://svgtranslate.toolforge.org/). Added translation for de.
    20:28, 23 August 2021Thumbnail for version as of 20:28, 23 August 20211,000 × 750 (12 KB)RCraig09 (talk | contribs)Version 2: narrowing vertical scale so trace occupies more of image
    04:03, 23 August 2021Thumbnail for version as of 04:03, 23 August 20211,000 × 750 (13 KB)RCraig09 (talk | contribs)Uploaded own work with UploadWizard


    You cannot overwrite this file.


    The following 23 pages use this file:

    User:RCraig09

    User:RCraig09/Excel to XML for SVG

    User talk:RCraig09

    User talk:RCraig09/Archive 1 (2009-2021)

    Commons:Graphic Lab/Illustration workshop/Archive/2021

    File:19811989 monthly unemployment, inflation, and interest rates.svg

    File:2011- Renewable energy capacity - International Energy Agency-cs.svg

    File:20200324 Global average temperature - NASA-GISS HadCrut NOAA Japan BerkeleyE.svg

    File:20210331 Global tree cover loss - World Resources Institute-cs.svg

    File:20210502 Warming stripes comparison of Global Mean Surface Temperature datasets.svg

    File:20210507 Warming stripes - ellipses - global warming.svg

    File:20210507 Warming stripes - octagons - global warming.svg

    File:20210507 Warming stripes - rectangles - global warming.svg

    File:20210507 Warming stripes - triangles - global warming.svg

    File:20210508 Warming stripes - hexagons - global warming.svg

    File:20210517 Warming stripes - pentagrams - stars - global warming.svg

    File:20210522 Warming stripes - longitudes - meridians on a globe - global warming.svg

    File:20210526 Warming stripes - hearts - global warming.svg

    File:20210530 Warming stripes - diamonds - global warming.svg

    File:20210604 Warming stripes - XLSX to SVG - various Diamond etc configurations - GIF.gif

    File:20210822 Global warming - warming stripes bar chart.svg

    File:20211109 Frequency of extreme weather for different degrees of global warming - bar chart IPCC AR6 WG1 SPM cs.svg

    File:20211109 Frequency of extreme weather for different degrees of global warming - bar chart IPCC AR6 WG1 SPM tl.svg


    File usage on other wikis


    The following other wikis use this file:

    Usage on en.wikipedia.org

    Talk:SVG

    Wikipedia:SVG help

    Talk:Data and information visualization

    User talk:RCraig09

    Warming stripes

    Talk:Warming stripes

    Wikipedia talk:WikiProject Countries/Archive 13

    Wikipedia talk:WikiProject Climate change/Archive 2

    Talk:Climate change/Archive 86

    User:RCraig09/Excel to XML for SVG

    User talk:RCraig09/Archive 2 (2020)

    Wikipedia:Graphics Lab/Illustration workshop/Archive/Apr 2021

    Passive daytime radiative cooling

    User talk:RCraig09/Archive 3 (2021-2022)

    User talk:RCraig09/Archive 4 (2023)


    Usage on gl.wikipedia.org

    Sexto informe de avaliación do Grupo intergobernamental sobre o cambio climático


    Usage on he.wikipedia.org

    הכחשת המציאות


    Metadata

    This file contains additional information such as Exif metadata which may have been added by the digital camera, scanner, or software program used to create or digitize it. If the file has been modified from its original state, some details such as the timestamp may not fully reflect those of the original file. The timestamp is only as accurate as the clock in the camera, and it may be completely wrong.

    Structured data

    Items portrayed in this file

    depicts

    climate change

    creator

    some value

    URL: https://commons.wikimedia.org/wiki/User:RCraig09
    author name string: RCraig09
    Wikimedia username: RCraig09

    copyright status

    copyrighted

    copyright license

    Creative Commons Attribution-ShareAlike 4.0 International

    inception

    22 August 2021

    source of file

    original creation by uploader

    media type

    image/svg+xml

    checksum

    930653bed5ae56e35060bfab64d9c770f60952ca

    determination method: SHA-1

    data size

    13,906 byte

    height

    750 pixel

    width

    1,000 pixel


    Retrieved from "https://commons.wikimedia.org/w/index.php?title=File:20210822_Global_warming_-_warming_stripes_bar_chart.svg&oldid=802177086"

    Categories: 
    Climate change diagrams
    Data visualization
    Global warming graphs
    SVG bar charts
    SVG diagrams created with spreadsheet
    Temperature diagrams
    Warming stripes
    RCraig09 charts showing data through 2020
    Hidden categories: 
    Pages using multiple image with auto scaled images
    Valid SVG created with Other tools:Charts
    Translation possible - SVG
    CC-BY-SA-4.0
    Self-published work


    Navigation menu


    Personal tools  


    English
    Not logged in
    Talk
    Contributions
    Create account
    Log in


    Namespaces  


    File
    Discussion