
|
No edit summary
|
|
||
| Line 730: | Line 730: | ||
}} |
}} |
||
{{Election box winning candidate with party link no change |
{{Election box winning candidate with party link no change |
||
| candidate = [[Steve Pearce (politician)|Steve Pearce]] |
| candidate = [[Steve Pearce (politician)|Steve Pearce]] (Incumbent) |
||
| party = Republican Party (US) |
| party = Republican Party (US) |
||
| votes = 133,180 |
| votes = 133,180 |
||
| Line 761: | Line 761: | ||
{{Election box winning candidate with party link no change |
{{Election box winning candidate with party link no change |
||
| party = Republican Party (US) |
| party = Republican Party (US) |
||
| candidate = [[Steve Pearce (politician)|Steve Pearce]] |
| candidate = [[Steve Pearce (politician)|Steve Pearce]] (Incumbent) |
||
| votes = 95,209 |
| votes = 95,209 |
||
| percentage = 64.43 |
| percentage = 64.43 |
||
| New Mexico's 2nd congressional district | |||
|---|---|---|---|
New Mexico's 2nd congressional district - since January 3, 2013.
| |||
| Representative |
| ||
| Distribution |
| ||
| Population (2019) | 705,615 | ||
| Median household income | $46,817[1] | ||
| Ethnicity |
| ||
| Cook PVI | R+8[2] | ||
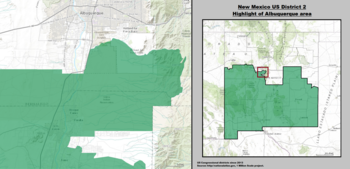
New Mexico's 2nd congressional district serves the southern half of New Mexico, including Las Cruces, Roswell, and the southern fourth of Albuquerque. Geographically, it is the fifth largest district in the nation, and the largest district that does not contain an entire state. It is currently represented by Republican Yvette Herrell.
Historically, the district has leaned more Republican than New Mexico's other two districts, particularly in presidential elections.
In the 2020 election, Republican candidate Yvette Herrell defeated Democratic representative Xochitl Torres Small in a rematch of their race in 2018. Herrell is the third Native woman elected to Congress and she assumed office on January 3, 2021.
Election results from presidential races[3][4]
| Year | Office | Result |
|---|---|---|
| 2000 | President | Bush 54 - 43% |
| 2004 | President | Bush 58 - 41% |
| 2008 | President | McCain 50 - 49% |
| 2012 | President | Romney 52 - 45% |
| 2016 | President | Trump 50 - 40% |
| 2018 | Senate | Heinrich 46 - 40% |
| 2018 | Governor | Pearce 53 - 47% |
| 2020 | President | Trump 55 - 43% |
| Party | Candidate | Votes | % | ||
|---|---|---|---|---|---|
| Republican | Ed Foreman | 71,857 | 50.48 | ||
| Democratic | E. S. Johnny Walker | 69,858 | 49.08 | ||
| Independent | Wilfredo Sedillo | 633 | 0.44 | ||
| Total votes | 142,348 | 100.0 | |||
| Republican win (new seat) | |||||
| Party | Candidate | Votes | % | |||
|---|---|---|---|---|---|---|
| Democratic | Harold L. Runnels | 64,518 | 51.37 | |||
| Republican | Ed Foreman (Incumbent) | 61,074 | 48.63 | |||
| Total votes | 125,592 | 100.0 | ||||
| Democratic gain from Republican | ||||||
| Party | Candidate | Votes | % | |
|---|---|---|---|---|
| Democratic | Harold L. Runnels (Incumbent) | 116,152 | 72.17 | |
| Republican | George E. Presson | 44,784 | 27.83 | |
| Total votes | 160,936 | 100.0 | ||
| Democratic hold | ||||
| Party | Candidate | Votes | % | |
|---|---|---|---|---|
| Democratic | Harold L. Runnels (Incumbent) | 90,127 | 66.74 | |
| Republican | Donald W. Trubey | 43,045 | 31.88 | |
| American Independent | Herbert Horton | 1,860 | 1.38 | |
| Total votes | 135,032 | 100.0 | ||
| Democratic hold | ||||
| Party | Candidate | Votes | % | |
|---|---|---|---|---|
| Democratic | Harold L. Runnels (Incumbent) | 123,563 | 70.33 | |
| Republican | Donald W. Trubey | 52,131 | 29.67 | |
| Total votes | 175,694 | 100.0 | ||
| Democratic hold | ||||
| Party | Candidate | Votes | % | |
|---|---|---|---|---|
| Democratic | Harold L. Runnels (Incumbent) | 95,710 | 100.00 | |
| Total votes | 95,710 | 100.0 | ||
| Democratic hold | ||||
| Party | Candidate | Votes | % | |||
|---|---|---|---|---|---|---|
| Republican | Joe Skeen (as a write-in) | 61,564 | 38.00 | |||
| Democratic | David King | 55,085 | 34.00 | |||
| Independent | Dorothy Runnels (as a write-in) | 45,343 | 28.00 | |||
| Total votes | 161,992 | 100.0 | ||||
| Republican gain from Democratic | ||||||
| Party | Candidate | Votes | % | |
|---|---|---|---|---|
| Republican | Joe Skeen (Incumbent) | 71,021 | 58.40 | |
| Democratic | Caleb Chandler | 50,599 | 41.60 | |
| Total votes | 121,620 | 100.0 | ||
| Republican hold | ||||
| Party | Candidate | Votes | % | |
|---|---|---|---|---|
| Republican | Joe Skeen (Incumbent) | 116,006 | 74.33 | |
| Democratic | Peter R. York | 40,063 | 25.67 | |
| Total votes | 156,069 | 100.0 | ||
| Republican hold | ||||
| Party | Candidate | Votes | % | |
|---|---|---|---|---|
| Republican | Joe Skeen (Incumbent) | 77,787 | 62.88 | |
| Democratic | Mike Runnels | 45,924 | 37.12 | |
| Total votes | 123,711 | 100.0 | ||
| Republican hold | ||||
| Party | Candidate | Votes | % | |
|---|---|---|---|---|
| Republican | Joe Skeen (Incumbent) | 100,324 | 100.00 | |
| Total votes | 100,324 | 100.0 | ||
| Republican hold | ||||
| Party | Candidate | Votes | % | |
|---|---|---|---|---|
| Republican | Joe Skeen (Incumbent) | 80,677 | 100.00 | |
| Total votes | 80,677 | 100.0 | ||
| Republican hold | ||||
| Party | Candidate | Votes | % | |
|---|---|---|---|---|
| Republican | Joe Skeen (Incumbent) | 94,838 | 56.39 | |
| Democratic | Dan Sosa Jr. | 73,157 | 43.50 | |
| Write-in | 175 | 0.11 | ||
| Total votes | 168,170 | 100.0 | ||
| Republican hold | ||||
| Party | Candidate | Votes | % | |
|---|---|---|---|---|
| Republican | Joe Skeen (Incumbent) | 89,966 | 63.28 | |
| Democratic | Benjamin Anthony Chavez | 45,316 | 31.87 | |
| Green | Rex R. Johnson | 6,898 | 4.85 | |
| Total votes | 142,180 | 100.0 | ||
| Republican hold | ||||
| Party | Candidate | Votes | % | |
|---|---|---|---|---|
| Republican | Joe Skeen (Incumbent) | 95,091 | 55.93 | |
| Democratic | E. Shirley Baca | 74,915 | 44.07 | |
| Total votes | 170,006 | 100.0 | ||
| Republican hold | ||||
| Party | Candidate | Votes | % | |
|---|---|---|---|---|
| Republican | Joe Skeen (Incumbent) | 85,077 | 57.93 | |
| Democratic | E. Shirley Baca | 61,796 | 42.07 | |
| Total votes | 146,873 | 100.0 | ||
| Republican hold | ||||
| Party | Candidate | Votes | % | |
|---|---|---|---|---|
| Republican | Joe Skeen (Incumbent) | 100,742 | 58.11 | |
| Democratic | Michael A. Montoya | 72,614 | 41.89 | |
| Total votes | 173,356 | 100.0 | ||
| Republican hold | ||||
| Party | Candidate | Votes | % | |
|---|---|---|---|---|
| Republican | Steve Pearce | 79,631 | 56.23 | |
| Democratic | John Arthur Smith | 61,916 | 43.72 | |
| Green | George L. Dewey (as a write-in) | 43 | 0.03 | |
| Republican | Padraig M. Lynch (as a write-in) | 39 | 0.02 | |
| Total votes | 141,629 | 100.0 | ||
| Republican hold | ||||
| Party | Candidate | Votes | % | |
|---|---|---|---|---|
| Republican | Steve Pearce (Incumbent) | 130,498 | 60.20 | |
| Democratic | Gary King | 86,292 | 39.80 | |
| Total votes | 216,790 | 100.0 | ||
| Republican hold | ||||
| Party | Candidate | Votes | % | |
|---|---|---|---|---|
| Republican | Steve Pearce (Incumbent) | 92,620 | 59.42 | |
| Democratic | Albert Kissling | 63,119 | 40.49 | |
| Democratic | C. Dean Burk (as a write-in) | 135 | 0.09 | |
| Total votes | 155,874 | 100.0 | ||
| Republican hold | ||||
| Party | Candidate | Votes | % | |||
|---|---|---|---|---|---|---|
| Democratic | Harry Teague | 129,572 | 55.96 | |||
| Republican | Edward R. Tinsley | 101,980 | 44.04 | |||
| Total votes | 231,552 | 100.0 | ||||
| Democratic gain from Republican | ||||||
| Party | Candidate | Votes | % | |||
|---|---|---|---|---|---|---|
| Republican | Steve Pearce | 94,053 | 55.40 | |||
| Democratic | Harry Teague (Incumbent) | 75,709 | 44.60 | |||
| Total votes | 169,762 | 100.0 | ||||
| Republican gain from Democratic | ||||||
| Party | Candidate | Votes | % | |
|---|---|---|---|---|
| Republican | Steve Pearce (Incumbent) | 133,180 | 59.06 | |
| Democratic | Evelyn Madrid Erhard | 92,162 | 40.87 | |
| Independent | Jack A. McGrann (Write-In) | 173 | 0.8 | |
| Total votes | 225,515 | 100.0 | ||
| Republican hold | ||||
| Party | Candidate | Votes | % | |
|---|---|---|---|---|
| Republican | Steve Pearce (Incumbent) | 95,209 | 64.43 | |
| Democratic | Rocky Lara | 52,499 | 35.52 | |
| Republican | Jack McGrann (Write-In) | 69 | 0.05 | |
| Total votes | 147,777 | 100 | ||
| Republican hold | ||||
| Party | Candidate | Votes | % | |
|---|---|---|---|---|
| Republican | Steve Pearce (Incumbent) | 143,514 | 62.72 | |
| Democratic | Merrie Lee Soules | 85,232 | 37.25 | |
| Republican | Jack A McGrann (write in) | 70 | 0.03 | |
| Total votes | 228,816 | 100 | ||
| Republican hold | ||||
| Party | Candidate | Votes | % | |||
|---|---|---|---|---|---|---|
| Democratic | Xochitl Torres Small | 101,489 | 50.90 | |||
| Republican | Yvette Herrell | 97,767 | 49.10 | |||
| Total votes | 199,256 | 100.0 | ||||
| Democratic gain from Republican | ||||||
| Party | Candidate | Votes | % | |
|---|---|---|---|---|
| Republican | Yvette Herrell | 142,169 | 53.75 | |
| Democratic | Xochitl Torres Small (incumbent) | 122,314 | 46.25 | |
| Total votes | 264,483 | 100.0 | ||
| Republican gain from Democratic | ||||

|
| |
|---|---|
|
33°23′07″N 106°17′58″W / 33.38528°N 106.29944°W / 33.38528; -106.29944


