
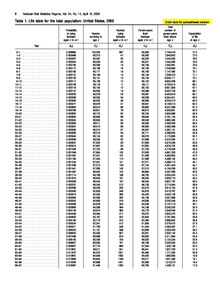
Inactuarial science and demography, a life table (also called a mortality tableoractuarial table) is a table which shows, for each age, the probability that a person of that age will die before their next birthday ("probability of death"). In other words, it represents the survivorship of people from a certain population.[1] They can also be explained as a long-term mathematical way to measure a population's longevity.[2] Tables have been created by demographers including John Graunt, Reed and Merrell, Keyfitz, and Greville.[2]
There are two types of life tables used in actuarial science. The period life table represents mortality rates during a specific time period for a certain population. A cohort life table, often referred to as a generation life table, is used to represent the overall mortality rates of a certain population's entire lifetime. They must have had to be born during the same specific time interval. A cohort life table is more frequently used because it is able to make a prediction of any expected changes in the mortality rates of a population in the future. This type of table also analyzes patterns in mortality rates that can be observed over time.[3] Both of these types of life tables are created based on an actual population from the present, as well as an educated prediction of the experience of a population in the near future.[3] In order to find the true life expectancy average, 100 years would need to pass and by then finding that data would be of no use as healthcare is continually advancing.[4]
Other life tables in historical demography may be based on historical records, although these often undercount infants and understate infant mortality, on comparison with other regions with better records, and on mathematical adjustments for varying mortality levels and life expectancies at birth.[5]
From this starting point, a number of inferences can be derived.
Life tables are also used extensively in biology and epidemiology. An area that uses this tool is Social Security. It examines the mortality rates of all the people who have Social Security to decide which actions to take.[3]
The concept is also of importance in product life cycle management.
All mortality tables are specific to environmental and life circumstances, and are used to probabilistically determine expected maximum age within those environmental conditions.


There are two types of life tables:
Static life tables sample individuals assuming a stationary population with overlapping generations. "Static life tables" and "cohort life tables" will be identical if population is in equilibrium and environment does not change. If a population were to have a constant number of people each year, it would mean that the probabilities of death from the life table were completely accurate. Also, an exact number of 100,000 people were born each year with no immigrationoremigration involved.[3] "Life table" primarily refers to period life tables, as cohort life tables can only be constructed using data up to the current point, and distant projections for future mortality.
Life tables can be constructed using projections of future mortality rates, but more often they are a snapshot of age-specific mortality rates in the recent past, and do not necessarily purport to be projections. For these reasons, the older ages represented in a life table may have a greater chance of not being representative of what lives at these ages may experience in future, as it is predicated on current advances in medicine, public health, and safety standards that did not exist in the early years of this cohort. A life table is created by mortality rates and census figures from a certain population, ideally under a closed demographic system. This means that immigration and emigration do not exist when analyzing a cohort. A closed demographic system assumes that migration flows are random and not significant, and that immigrants from other populations have the same risk of death as an individual from the new population. Another benefit from mortality tables is that they can be used to make predictions on demographics or different populations.[7]
However, there are also weaknesses of the information displayed on life tables. One being that they do not state the overall health of the population. There is more than one disease present in the world, and a person can have more than one disease at different stages simultaneously, introducing the term comorbidity.[8] Therefore, life tables also do not show the direct correlation of mortality and morbidity.[9]
The life table observes the mortality experience of a single generation, consisting of 100,000 births, at every age number they can live through.[3]
Life tables are usually constructed separately for men and for women because of their substantially different mortality rates. Other characteristics can also be used to distinguish different risks, such as smoking status, occupation, and socioeconomic class.
Life tables can be extended to include other information in addition to mortality, for instance health information to calculate health expectancy. Health expectancies such as disability-adjusted life year and Healthy Life Years are the remaining number of years a person can expect to live in a specific health state, such as free of disability. Two types of life tables are used to divide the life expectancy into life spent in various states:
Life tables that relate to maternal deaths and infant moralities are important, as they help form family planning programs that work with particular populations. They also help compare a country's average life expectancy with other countries.[2] Comparing life expectancy globally helps countries understand why one country's life expectancy is rising substantially by looking at each other's healthcare, and adopting ideas to their own systems.[10]
In order to price insurance products, and ensure the solvency of insurance companies through adequate reserves, actuaries must develop projections of future insured events (such as death, sickness, and disability). To do this, actuaries develop mathematical models of the rates and timing of the events. They do this by studying the incidence of these events in the recent past, and sometimes developing expectations of how these past events will change over time (for example, whether the progressive reductions in mortality rates in the past will continue) and deriving expected rates of such events in the future, usually based on the age or other relevant characteristics of the population. An actuary's job is to form a comparison between people at risk of death and people who actually died to come up with a probability of death for a person at each age number, defined as qx in an equation.[7] When analyzing a population, one of the main sources used to gather the required information is insurance by obtaining individual records that belong to a specific population.[7] These are called mortality tables if they show death rates, and morbidity tables if they show various types of sickness or disability rates.
The availability of computers and the proliferation of data gathering about individuals has made possible calculations that are more voluminous and intensive than those used in the past (i.e. they crunch more numbers) and it is more common to attempt to provide different tables for different uses, and to factor in a range of non-traditional behaviors (e.g. gambling, debt load) into specialized calculations utilized by some institutions for evaluating risk. This is particularly the case in non-life insurance (e.g. the pricing of motor insurance can allow for a large number of risk factors, which requires a correspondingly complex table of expected claim rates). However the expression "life table" normally refers to human survival rates and is not relevant to non-life insurance.

The basic algebra used in life tables is as follows.
 : the probability that someone aged exactly
  will die before reaching age
  .
. : the probability that someone aged exactly will survive to age .
 : the number of people who survive to age
  lives, typically taken as 100,000

 : the number of people who die aged last birthday
 : the probability that someone aged exactly will survive for
  more years, i.e. live up to at least age
  years
years
 : the probability that someone aged exactly will survive for more years, then die within the following
  years
years
Another common variable is

This symbol refers to central rate of mortality. It is approximately equal to the average force of mortality, averaged over the year of age.
Further descriptions: The variable dx stands for the number of deaths that would occur within two consecutive age numbers. An example of this is the number of deaths in a cohort that were recorded between the age of seven and the age of eight. The variable ℓx, which stands for the opposite of dx, represents the number of people who lived between two consecutive age numbers. ℓ of zero is equal to 100,000. The variable Tx stands for the years lived beyond each age number x by all members in the generation. Ėx represents the life expectancy for members already at a specific age number.[3]
In practice, it is useful to have an ultimate age associated with a mortality table. Once the ultimate age is reached, the mortality rate is assumed to be 1.000. This age may be the point at which life insurance benefits are paid to a survivor or annuity payments cease.
Four methods can be used to end mortality tables:[12]
Inepidemiology and public health, both standard life tables (used to calculate life expectancy), as well as the Sullivan and multi-state life tables (used to calculate health expectancy), are the most commonly mathematical used devices. The latter includes information on health in addition to mortality. By watching over the life expectancy of any year(s) being studied, epidemiologists can see if diseases are contributing to the overall increase in mortality rates.[13] Epidemiologists are able to help demographers understand the sudden decline of life expectancy by linking it to the health problems that are arising in certain populations.[13]