| IANA Unallocated Address Pool Exhaustion: | |||
| 03-Feb-2011 | |||
| | |||
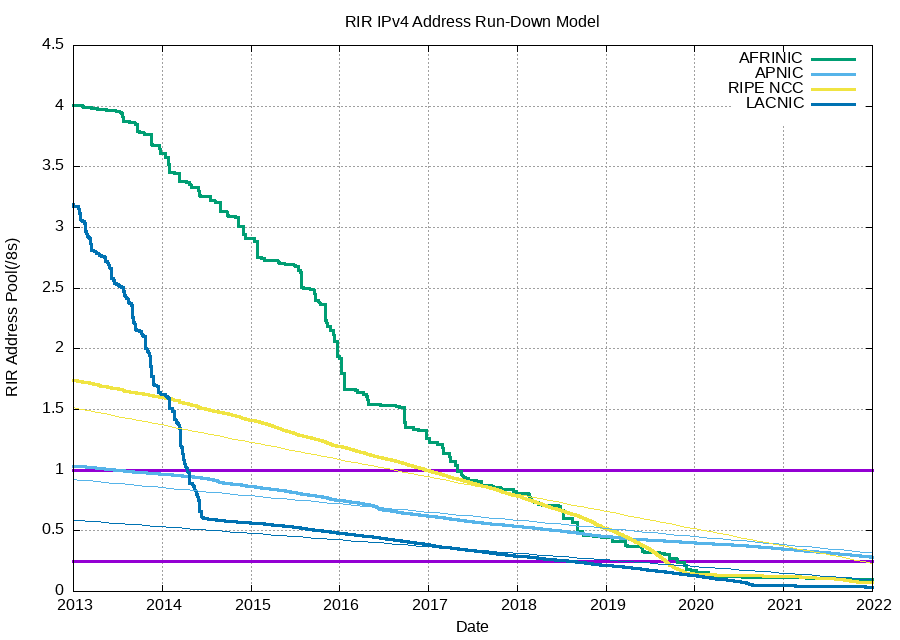
| Projected RIR Address Pool Exhaustion Dates: | |||
| RIR | Projected Exhaustion Date | Remaining Addresses in RIR Pool (/8s) | |
| APNIC: | 19-Apr-2011 (actual) | 0.1388 | |
| RIPE NCC: | 14-Sep-2012 (actual) | 0.0001 | |
| LACNIC: | 10-Jun-2014 (actual) | 0.0001 | |
| ARIN: | 24 Sep-2015 (actual) | 0.0006 | |
| AFRINIC: | 31-Dec--1 | 0.0663 | |
Projection of consumption of Remaining RIR Address Pools
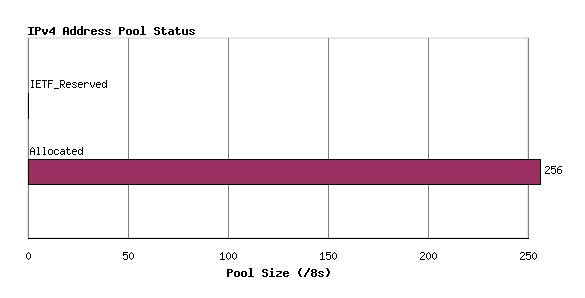 Figure 1 - Address Pool Status
This allocated number pool is managed by the Regional Internet
Registries, (RIRs) and the breakdown of IANA allocated address
blocks to each of the RIRs is shown in Figure 2.
Figure 1 - Address Pool Status
This allocated number pool is managed by the Regional Internet
Registries, (RIRs) and the breakdown of IANA allocated address
blocks to each of the RIRs is shown in Figure 2.
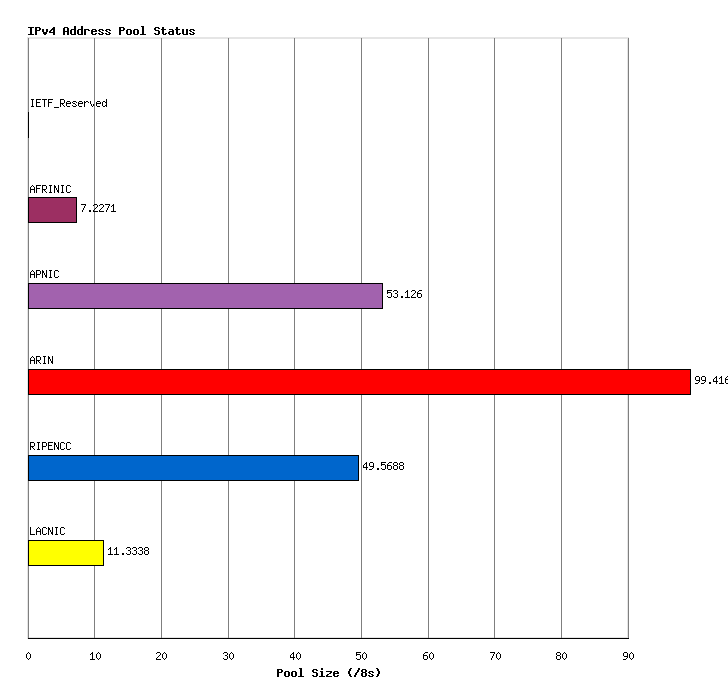 Figure 2 - Address allocations to RIRs
Any individual IPv4 address can be in any one of five states:
●reserved for special use, or
●part of the IANA unallocated
address pool,
●part of the unassigned pool held by an RIR,
●assigned to an end user entity but not advertised in the routing
system, or
●assigned and advertised in BGP.
The current
totals of IP addresses according to this set of states is shown in
Figure 3.
Figure 2 - Address allocations to RIRs
Any individual IPv4 address can be in any one of five states:
●reserved for special use, or
●part of the IANA unallocated
address pool,
●part of the unassigned pool held by an RIR,
●assigned to an end user entity but not advertised in the routing
system, or
●assigned and advertised in BGP.
The current
totals of IP addresses according to this set of states is shown in
Figure 3.
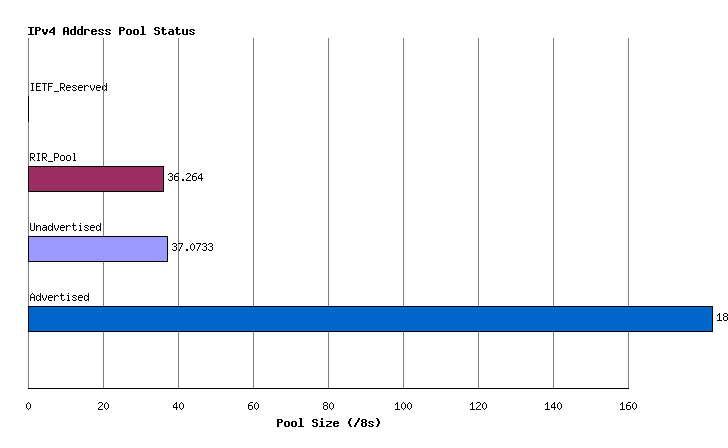 Figure 3 - Address Pools by State
This status can be further categorized per RIR, as shown in Figure 4.
Figure 3 - Address Pools by State
This status can be further categorized per RIR, as shown in Figure 4.
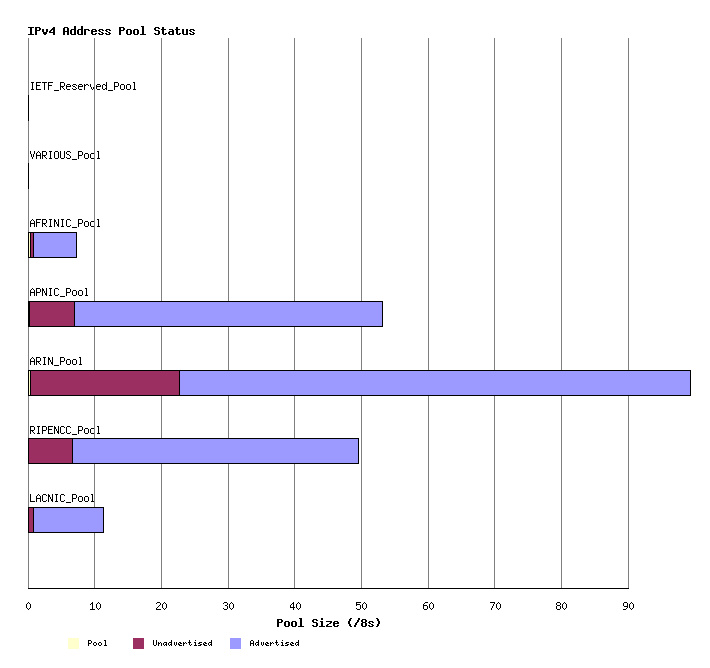 Figure 4 - Address Pools by RIR by State
Another view of the address state pools is by grouping the address
space into a sequence of /8s, and looking at state sub totals within
each /8 address block. The following view shows the current status
of the IPv4 address space as 256 /8 columns each describing a pool
of 16,777,216 addresses.
Figure 4 - Address Pools by RIR by State
Another view of the address state pools is by grouping the address
space into a sequence of /8s, and looking at state sub totals within
each /8 address block. The following view shows the current status
of the IPv4 address space as 256 /8 columns each describing a pool
of 16,777,216 addresses.
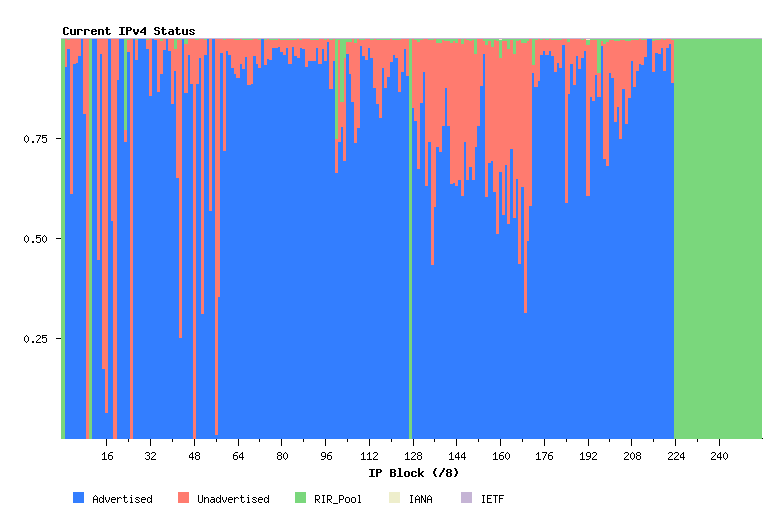 Figure 5 - IPv4 Address Status
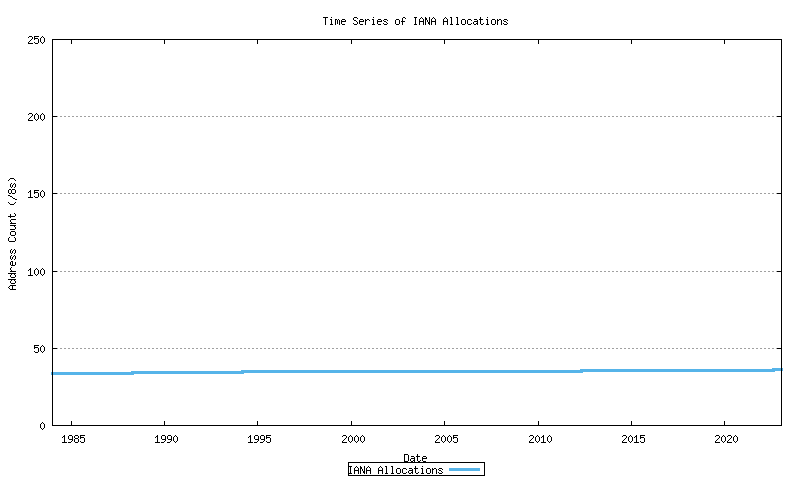 Figure 6 - Cumulative IANA Address allocations
This series can be further broken down by RIR.
Figure 6 - Cumulative IANA Address allocations
This series can be further broken down by RIR.
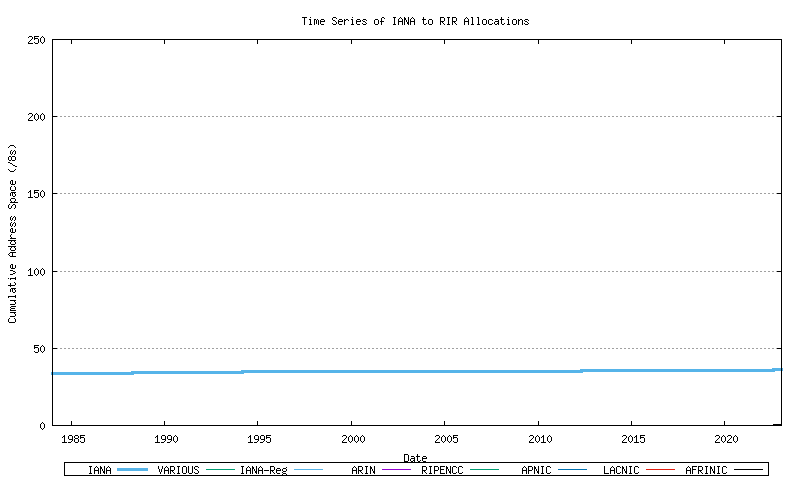 Figure 7 - Cumulative IANA Address block allocations per RIR
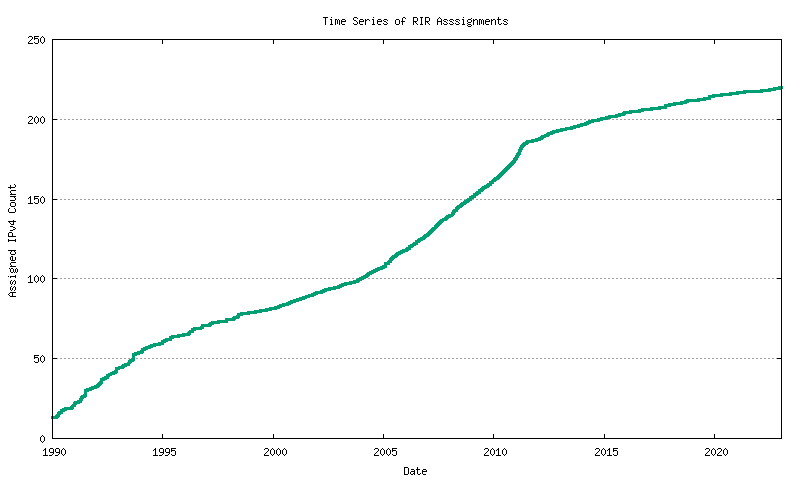 Figure 8 - Cumulative RIR Address assignments
This data can be further categorized by RIR.
Figure 8 - Cumulative RIR Address assignments
This data can be further categorized by RIR.
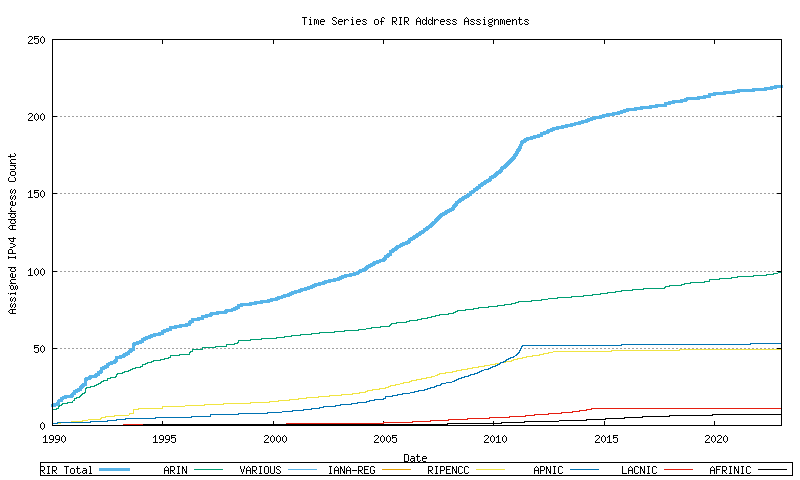 Figure 9 - Cumulative RIR address assignments, per RIR
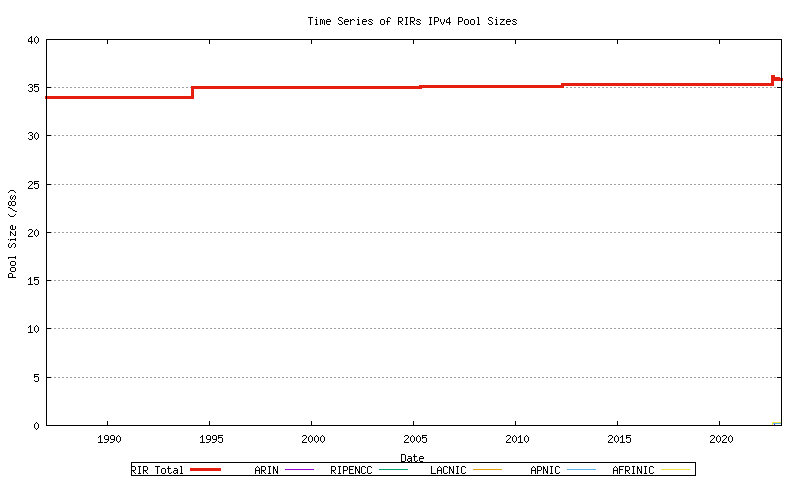 Figure 10 - RIR Address Pool size
The more recent data from this series is shown in Figure 10a.
Figure 10 - RIR Address Pool size
The more recent data from this series is shown in Figure 10a.
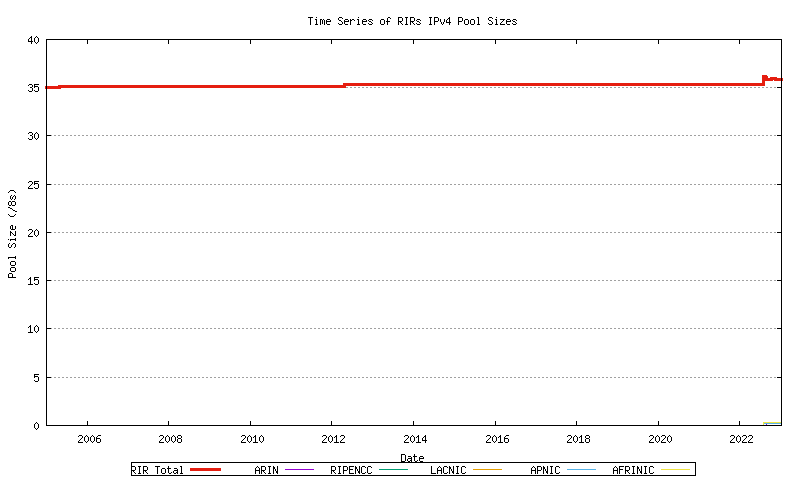 Figure 10a - RIR Address Pool size
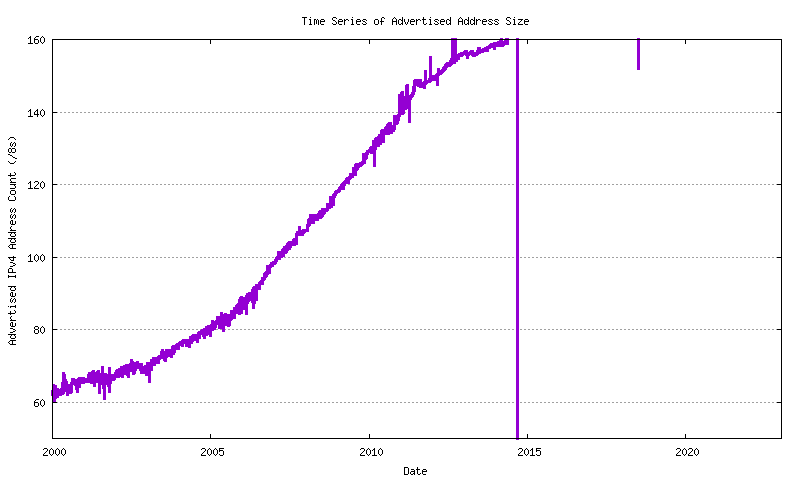 Figure 11 - Advertised Address Countu
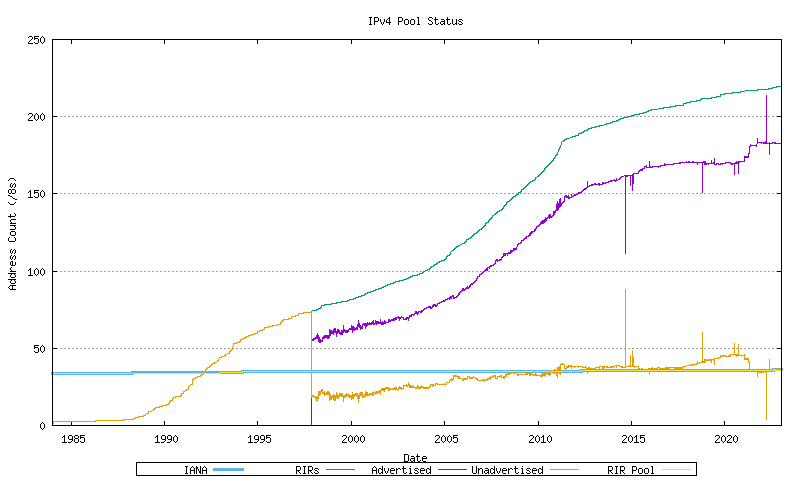 Figure 16 - IPv4 Address Pool Status
The more recent section of these series is indicated in Figure 17.
The approach used here is to take a recent sequence of data as the
baseline for a predictive model.
Figure 16 - IPv4 Address Pool Status
The more recent section of these series is indicated in Figure 17.
The approach used here is to take a recent sequence of data as the
baseline for a predictive model.
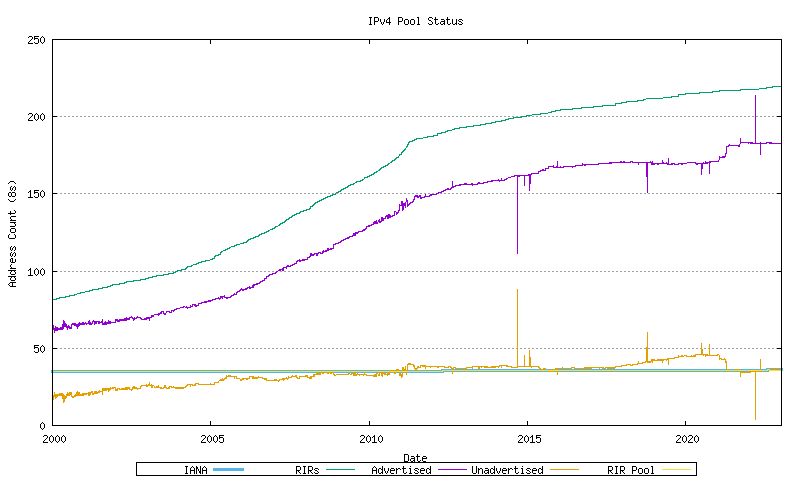 Figure 17 - IPv4 Address Pool Status - since 2000
 Figure 18 - IANA Allocation Series
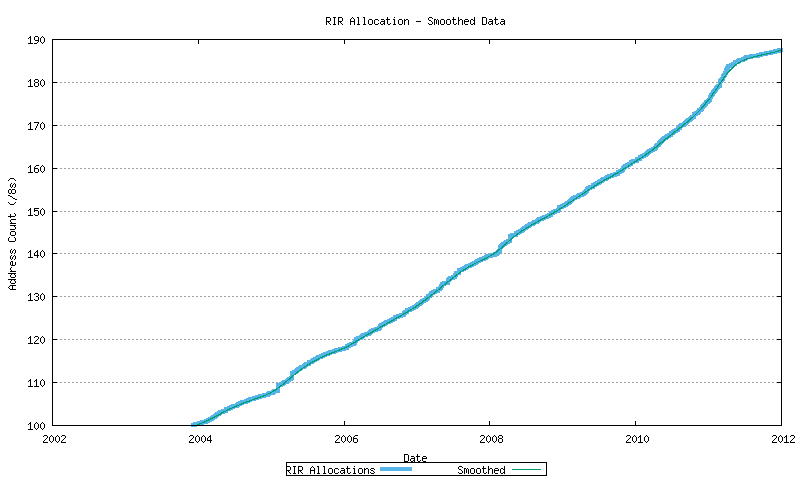 Figure 19 - RIR Allocation Series
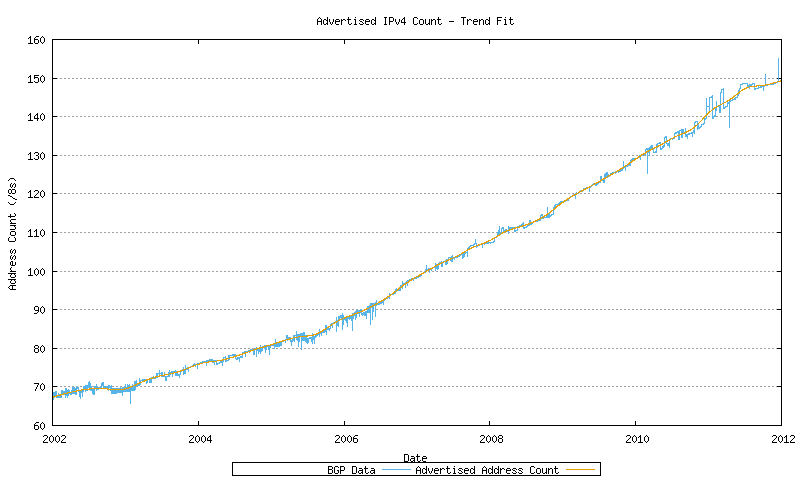 Figure 20 - BGP Advertised Series
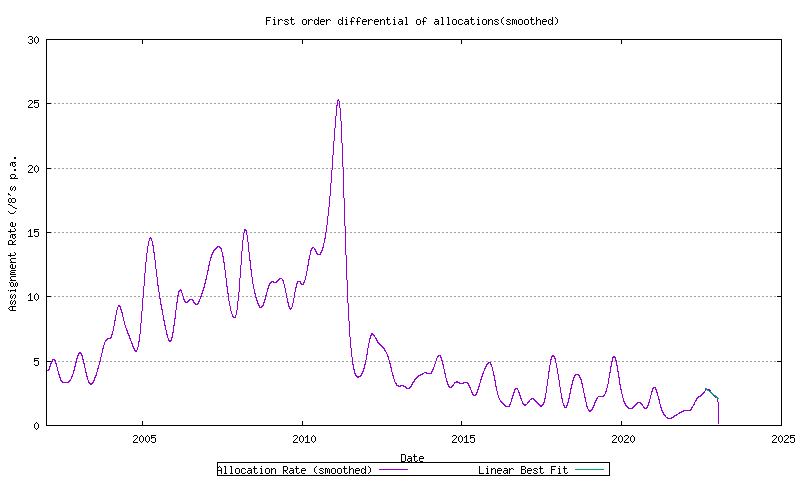 Figure 27 - Rate of RIR Allocations - First order differential of allocation data series
The allocation rates for each RIR are shown in the following figures.
Figure 27 - Rate of RIR Allocations - First order differential of allocation data series
The allocation rates for each RIR are shown in the following figures.
 Figure 28a - AFRINIC Address Allocation Rate
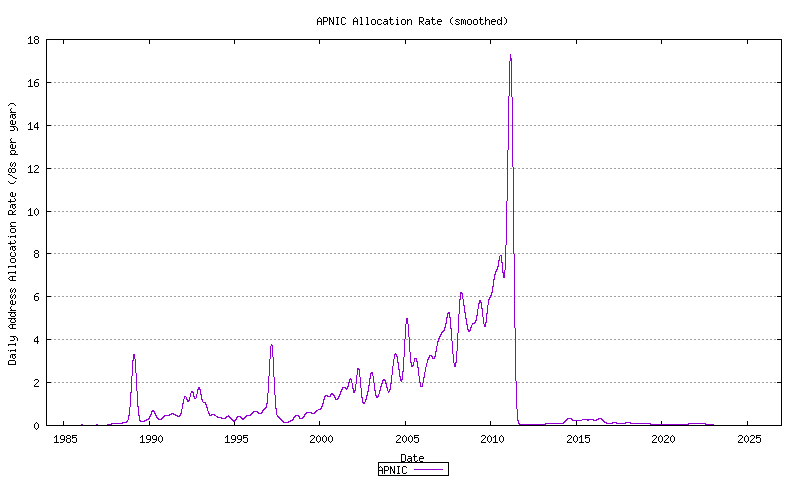 Figure 28b - APNIC Address Allocation Rate
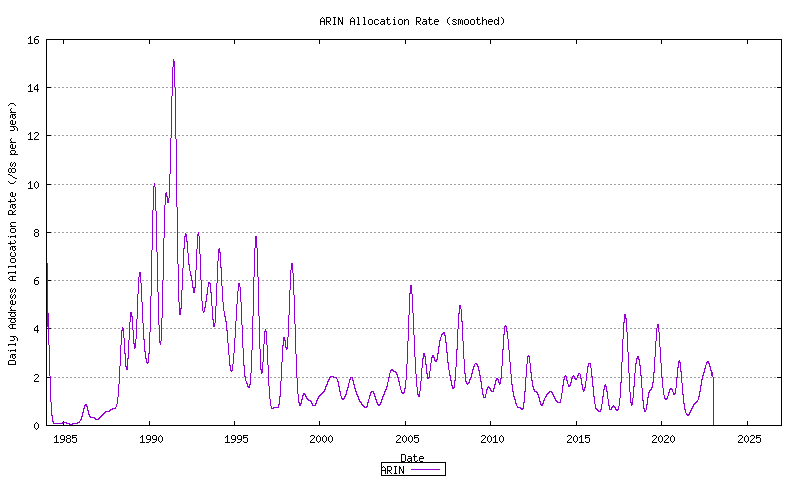 Figure 28c - ARIN Address Allocation Rate
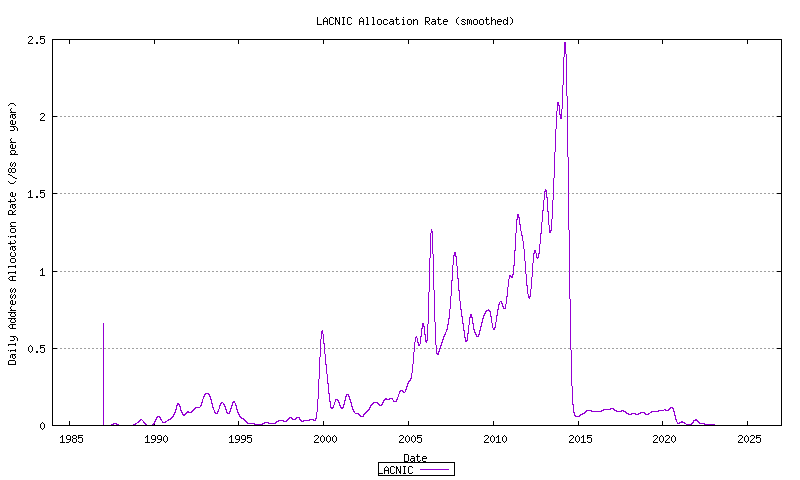 Figure 28d - LACNIC Address Allocation Rate
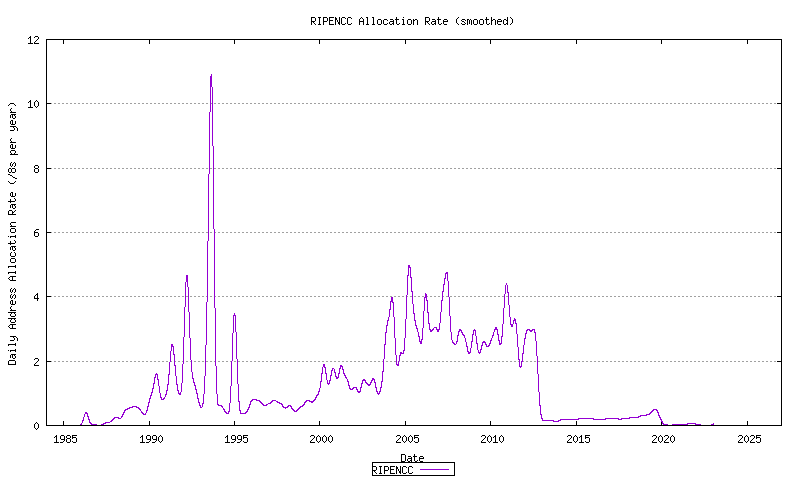 Figure 28e - RIPE NCC Address Allocation Rate
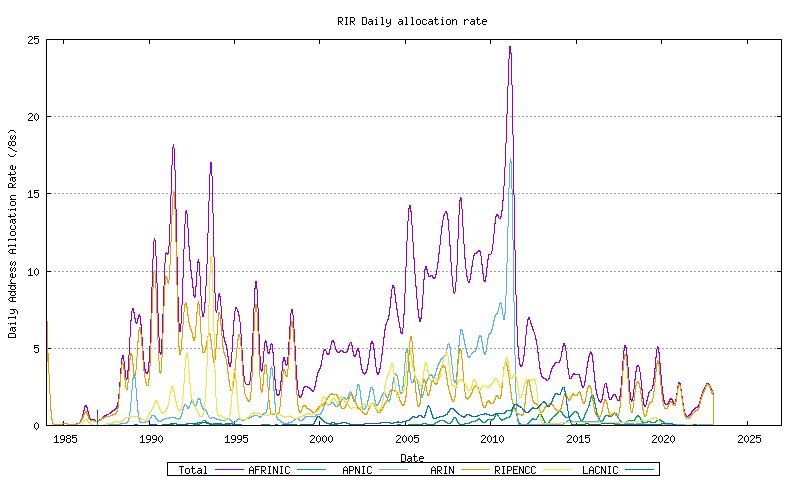 Figure 28f - Combined Address Allocation Rate
Geoff Huston
Figure 28f - Combined Address Allocation Rate
Geoff Huston