|
→2004: removed brackets to dead link
|
→2006: removed brackets to dead link
|
||
| Line 571: | Line 571: | ||
{{Election box candidate with party link| |
{{Election box candidate with party link| |
||
|party = Libertarian Party (United States) |
|party = Libertarian Party (United States) |
||
|candidate = |
|candidate = Erik Buck |
||
|votes = 4,757 |
|votes = 4,757 |
||
|percentage = 1.94% |
|percentage = 1.94% |
||
| Missouri's 6th congressional district | |
|---|---|

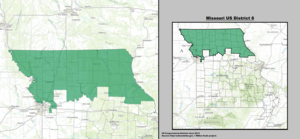
Interactive map of district boundaries since January 3, 2023
| |
| Representative | |
| Population (2021) | 771,992 |
| Median household income | $64,857[1] |
| Ethnicity |
|
| Cook PVI | R+21[2] |
Missouri's 6th congressional district takes in a large swath of land in northern Missouri, stretching across nearly the entire width of the state from KansastoIllinois. Its largest voting population is centered in the northern portion of the Kansas City metropolitan area and the town of St. Joseph. The district includes nearly all of Kansas City north of the Missouri River (including Kansas City International Airport).

The district takes in all or parts of the following counties: Adair, Andrew, Atchison, Buchanan, Caldwell, Carroll, Chariton, Clark, Clay, Clinton, Daviess, De Kalb, Gentry, Grundy, Harrison, Holt, Jackson, Knox, Lewis, Linn, Livingston, Macon, Marion, Mercer, Monroe, Nodaway, Pike, Platte, Putnam, Ralls, Schuyler, Scotland, Shelby, Sullivan, Worth.
Notable representatives from the district include governors John Smith Phelps and Austin A. King as well as Kansas City Mayor Robert T. Van Horn. In 1976, Jerry Litton was killed on election night as he flew to a victory party after winning the Democratic nomination for United States Senate. The visitors center at Smithville Lake is named in Litton's memory. Democrat Pat Danner, a former aide to Jerry Litton, won the seat in 1992 becoming the first woman to be elected in the district defeating a 16-year Republican incumbent.
George W. Bush beat John Kerry in this district 57%–42% in 2004. The district is represented by Republican Sam Graves, who has held the seat since 2001. Graves easily held on to his seat what was expected to be a tough 2008 election, defeating former Kansas City mayor Kay Waldo Barnes by 23 percentage points.
Historically, the 6th was not safe for either party. However, in recent years, it has trended Republican, mirroring the increasingly conservative bent of the more rural areas of Missouri that historically voted for Yellow Dog Democrats.
After Missouri lost a congressional seat following the 2010 census (in part because of losses in population in several rural northern Missouri counties), the 6th was expanded to include most of Missouri north of the Missouri River, stretching from border to border from Kansas to Illinois. The biggest geographic addition was in northeast Missouri (including Kirksville, Missouri and Hannibal, Missouri), which used to be the northern half of the old 9th district.[3]
The 6th lost Cooper and Howard counties to the 4th district, and Gladstone in southwestern Clay County to the 5th district. Meanwhile, the 6th was extended into Jackson County for the first time, taking in the northeastern portion between the Missouri River and Interstate 70, as well as a small sliver southwest of Independence.
| Year | Office | Results |
|---|---|---|
| 2000 | President | George W. Bush 53 – Al Gore 44% |
| 2004 | President | George W. Bush 57 – John Kerry 42% |
| 2008 | President | John McCain 54 – Barack Obama 45% |
| 2012 | President | Mitt Romney 60 – Barack Obama 38% |
| 2016 | President | Donald Trump 63 – Hillary Clinton 32% |
| 2020 | President | Donald Trump 63 – Joe Biden 35% |
|
1996 • 1998 • 2000 • 2002 • 2004• 2006• 2008• 2010• 2012• 2014• 2016• 2018• 2020 |
| Party | Candidate | Votes | % | ±% | |
|---|---|---|---|---|---|
| Democratic | Pat Danner | 169,006 | 68.6% | ||
| Republican | Jeff Bailey | 72,064 | 29.3% | ||
| Libertarian | Karl H. Wetzel | 5,212 | 2.1% | ||
| Total votes | 246,282 | 100% | |||
| Majority | |||||
| Turnout | |||||
| Democratic hold | Swing | ||||
| Party | Candidate | Votes | % | ±% | |
|---|---|---|---|---|---|
| Democratic | Pat Danner (Incumbent) | 136,774 | 70.9% | ||
| Republican | Jeff Bailey | 51,679 | 26.8% | ||
| Libertarian | Karl H. Wetzel | 4,324 | 2.2% | ||
| Total votes | 129,777 | 100% | |||
| Majority | |||||
| Turnout | |||||
| Democratic hold | Swing | ||||
| Party | Candidate | Votes | % | ±% | |
|---|---|---|---|---|---|
| Republican | Samuel B. Graves, Jr. | 138,925 | 50.9% | ||
| Democratic | Steve Danner | 127,792 | 46.8% | ||
| Libertarian | Jimmy Dykes | 3,696 | 1.4% | ||
| Independent | Marie Richey | 2,788 | 1.0% | ||
| Total votes | 273,201 | 100% | |||
| Majority | |||||
| Turnout | |||||
| Republican gain from Democratic | Swing | ||||
| Party | Candidate | Votes | % | ±% | |
|---|---|---|---|---|---|
| Republican | Samuel B. Graves, Jr. (Incumbent) | 131,151 | 63.0% | ||
| Democratic | Cathy Rinehart | 73,202 | 35.2% | ||
| Libertarian | Erik Buck | 3,735 | 1.8% | ||
| Total votes | 208,088 | 100% | |||
| Majority | |||||
| Turnout | |||||
| Republican hold | Swing | ||||
| Party | Candidate | Votes | % | ±% | |
|---|---|---|---|---|---|
| Republican | Samuel B. Graves, Jr. (Incumbent) | 196,516 | 63.83% | ||
| Democratic | Charles S. Broomfield | 106,987 | 34.75% | ||
| Libertarian | Erik Buck | 4,352 | 1.41% | ||
| Total votes | 307,885 | 100% | |||
| Majority | |||||
| Turnout | |||||
| Republican hold | Swing | ||||
| Party | Candidate | Votes | % | ±% | |
|---|---|---|---|---|---|
| Republican | Samuel B. Graves, Jr. (Incumbent) | 150,882 | 61.64% | ||
| Democratic | Sara Jo Shettles | 87,477 | 35.73% | ||
| Libertarian | Erik Buck | 4,757 | 1.94% | ||
| Progressive | Shirley A. Yurkonis | 1,679 | 0.69% | ||
| Total votes | 244,795 | 100% | |||
| Majority | |||||
| Turnout | |||||
| Republican hold | Swing | ||||
| Party | Candidate | Votes | % | ±% | |
|---|---|---|---|---|---|
| Republican | Samuel B. Graves, Jr. (Incumbent) | 196,526 | 59.4% | ||
| Democratic | Kay Barnes | 121,894 | 36.9% | ||
| Libertarian | Dave Browning | 12,279 | 3.7% | ||
| Total votes | 330,699 | 100% | |||
| Majority | 62,353 | 18.8% | |||
| Turnout | |||||
| Republican hold | Swing | ||||
| Party | Candidate | Votes | % | |
|---|---|---|---|---|
| Republican | Sam Graves (incumbent) | 154,103 | 69.44 | |
| Democratic | Clint Hylton | 67,762 | 30.54 | |
| Write-In | Kyle Yarber | 47 | 0.02 | |
| Total votes | 221,912 | 100.00 | ||
| Party | Candidate | Votes | % | |
|---|---|---|---|---|
| Republican | Sam Graves (incumbent) | 216,906 | 65.0 | |
| Democratic | Kyle Yarber | 108,503 | 32.5 | |
| Libertarian | Russ Lee Monchil | 8,279 | 2.5 | |
| Total votes | 333,688 | 100.0 | ||
| Republican hold | ||||
| Party | Candidate | Votes | % | |
|---|---|---|---|---|
| Republican | Sam Graves (incumbent) | 124,616 | 66.6 | |
| Democratic | W. A. (Bill) Hedge | 55,157 | 29.5 | |
| Libertarian | Russ Monchil | 7,197 | 3.9 | |
| Total votes | 186,970 | 100.0 | ||
| Republican hold | ||||
| Party | Candidate | Votes | % | |
|---|---|---|---|---|
| Republican | Sam Graves (incumbent) | 238,388 | 68.0 | |
| Democratic | David Blackwell | 99,692 | 28.5 | |
| Libertarian | Russ Lee Monchil | 8,123 | 2.3 | |
| Green | Mike Diel | 4,241 | 1.2 | |
| Total votes | 350,444 | 100.0 | ||
| Republican hold | ||||
| Party | Candidate | Votes | % | |
|---|---|---|---|---|
| Republican | Sam Graves (incumbent) | 199,796 | 65.4 | |
| Democratic | Henry Martin | 97,660 | 32.0 | |
| Libertarian | Dan Hogan | 7,953 | 2.6 | |
| Total votes | 305,409 | 100.0 | ||
| Republican hold | ||||
| Party | Candidate | Votes | % | |
|---|---|---|---|---|
| Republican | Sam Graves (incumbent) | 258,709 | 67.1 | |
| Democratic | Gena Ross | 118,926 | 30.8 | |
| Libertarian | Jim Higgins | 8,144 | 2.1 | |
| Total votes | 385,779 | 100.0 | ||
| Republican hold | ||||
|
| |
|---|---|
|
39°56′53″N 93°17′37″W / 39.94806°N 93.29361°W / 39.94806; -93.29361