| Missouri's 8th congressional district | |
|---|---|

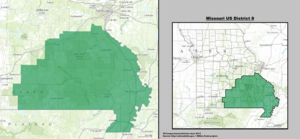
Interactive map of district boundaries since January 3, 2023
| |
| Representative | |
| Distribution |
|
| Population (2022) | 775,424 |
| Median household income | $53,903[1] |
| Ethnicity |
|
| Cook PVI | R+28[2] |
Missouri's 8th congressional district is one of 435 congressional districts in the United States and one of eight congressional districts in the state of Missouri. The district encompasses rural Southeast Missouri and South Central Missouri as well as some counties in Southwest Missouri. The district stretches from the Bootheel in the south to the St. Louis southern exurbs of Festus, Hillsboro, and surrounding areas in the Lead Belt; it ranges in the east to counties along the Mississippi River and in the west to counties along the Ozark Plateau near Branson. With a Cook Partisan Voting Index rating of R+28, it is the most Republican district in Missouri.[2]
The district's largest city is Cape Girardeau. A predominantly rural district, the district votes strongly Republican for national offices. In 2004, President George W. Bush received 63% of the vote in the district over U.S. Senator John Kerry (D-Massachusetts) who clinched 36%. In 2008, U.S. Senator John McCain (R-Arizona) carried the district with 61.92% over U.S. Senator Barack Obama (D-Illinois), who received 36.42%. The district increased the margin for Republicans in 2012 when former Governor Mitt Romney (R-Massachusetts) gained 65.88% of the vote over President Barack Obama's 31.99%. The district swung towards Republican Donald Trump in the 2016 presidential election. Trump garnered 75.4% of the vote, Democratic Nominee Hillary Clinton received just 21.0% of the vote, making it one of the most strongly Republican congressional districts in the United States.
Jason T. Smith, a Republican, has represented the district in the U.S. Congress since winning a special election on June 4, 2013. The incumbent Republican U.S. Representative Jo Ann Emerson resigned on January 22, 2013 to take a position as CEO for the National Rural Electric Cooperative Association.
Missouri lost one of its nine congressional district seats following redistricting based on population numbers from the 2010 U.S. census. The Republican-controlled state legislature decided to redefine Missouri's 3rd congressional district, which was represented by U.S. Representative Russ Carnahan (D-St. Louis). The district included all of Ste. Genevieve and Jefferson counties and southern St. Louis County and the neighborhoods making up what is known as South City of St. Louis. Missouri's 8th congressional district lost its Taney County parts (which were redistricted to the Southwestern-based 7th congressional district, and picked up all of Crawford and Ste. Genevieve counties, and most of the southern and western rural parts of Jefferson County. Parts of Jefferson County that are now included in Missouri's 8th include all of the cities of Hillsboro and De Soto, and the extreme southern portions of the Twin Cities of Festus and Crystal City (most of these two cities are now part of the 2nd congressional district).
| Year | Office | Results |
|---|---|---|
| 2000 | President | George W. Bush 59 - Al Gore 39% |
| 2004 | President | George W. Bush 64 - John Kerry 36% |
| 2008 | President | John McCain 62 - Barack Obama 36% |
| 2012 | President | Mitt Romney 66 - Barack Obama 32% |
| 2016 | President | Donald Trump 75 - Hillary Clinton 21% |
| 2020 | President | Donald Trump 77 - Joe Biden 21% |
| Party | Candidate | Votes | % | |
|---|---|---|---|---|
| Republican | Jo Ann Emerson (incumbent) | 216,083 | 71.93 | |
| Democratic | Jack Rushin | 73,755 | 24.55 | |
| Libertarian | Rob Vandeven | 10,553 | 3.51 | |
| Total votes | 300,391 | 100.00 | ||
| Republican hold | ||||
| Party | Candidate | Votes | % | ||
|---|---|---|---|---|---|
| Republican | Jason Smith | 42,141 | 67.1 | ||
| Democratic | Steve Hodges | 17,207 | 27.4 | ||
| Constitution | Doug Enyart | 2,265 | 3.6 | ||
| Libertarian | Bill Slantz | 968 | 1.5 | ||
| Write-in | 185 | 0.3 | |||
| Total votes | 62,766 | 100 | |||
| Republican hold | |||||
| Party | Candidate | Votes | % | |
|---|---|---|---|---|
| Republican | Jason Smith (incumbent) | 106,124 | 66.6 | |
| Democratic | Barbara Stocker | 38,721 | 24.3 | |
| Independent | Terry Hampton | 6,821 | 4.3 | |
| Constitution | Doug Enyart | 3,799 | 2.4 | |
| Libertarian | Rick Vandeven | 3,759 | 2.4 | |
| Total votes | 159,224 | 100.0 | ||
| Republican hold | ||||
| Party | Candidate | Votes | % | |
|---|---|---|---|---|
| Republican | Jason Smith (incumbent) | 229,792 | 74.4 | |
| Democratic | Dave Cowell | 70,009 | 22.7 | |
| Libertarian | Jonathan Shell | 9,070 | 2.9 | |
| Total votes | 308,871 | 100.0 | ||
| Republican hold | ||||
| Party | Candidate | Votes | % | |
|---|---|---|---|---|
| Republican | Jason Smith (incumbent) | 194,042 | 73.4 | |
| Democratic | Kathy Ellis | 66,151 | 25.0 | |
| Libertarian | Jonathan Shell | 4,206 | 1.6 | |
| Total votes | 264,399 | 100.0 | ||
| Republican hold | ||||
| Party | Candidate | Votes | % | |
|---|---|---|---|---|
| Republican | Jason Smith (incumbent) | 253,811 | 76.9 | |
| Democratic | Kathy Ellis | 70,561 | 21.4 | |
| Libertarian | Tom Schmitz | 5,854 | 1.8 | |
| Total votes | 330,226 | 100.0 | ||
| Republican hold | ||||
Missouri's 8th is a relatively diverse congressional district. Although it is quite conservative and Republican-leaning at the federal level, Democrats formerly performed well here in local and state elections. Bill Clinton, a Democrat from neighboring Arkansas, carried the previous 8th district both times in 1992 and 1996; since then, however, voters in the district have solidly supported the past three Republican presidential nominees.
At the local level, Republicans control a majority of elected county offices in Southeast Missouri. In presidential elections, Democratic candidates formerly performed best in the Bootheel, an agricultural area that is the most impoverished region in the district (and the state, for that matter). It has a wide majority of whites and a significant minority of African Americans. Democrats also used to do well in the Lead Belt region, which contains a core constituency of voters who belong to labor unions, particularly in the mining industry.
The district takes in a large swath of the Bible Belt with evangelical Protestantism being the dominant religion in most counties in the district. This influence is demonstrated in conservative voters' positions on social issues such as abortion, gay rights and gun control. Racially, this district is predominantly white. Many voters here maintain a rural lifestyle where agriculture and farming are the backbone of the economy and are important issues of concern. Socioeconomically, it is the poorest district in Missouri (when measured by the median household income adjusted by inflation).
There are 28 counties included in the district.
|
The 10 largest cities in the district are as follows.
| Rank | City | County | Population (2010) | Population (2015) | Population (2020) |
|---|---|---|---|---|---|
| 1 | Cape Girardeau | Cape Girardeau and Scott | 37,941 | 39,462 | 39,540 |
| 2 | Arnold | Jefferson | 20,875 | 21,213 | 20,858 |
| 3 | Rolla | Phelps | 19,559 | 20,019 | 19,943 |
| 4 | Farmington | St. Francois | 16,240 | 18,181 | 18,217 |
| 5 | Sikeston | Scott and New Madrid | 16,318 | 16,436 | 16,291 |
| 6 | Poplar Bluff | Butler | 17,023 | 17,266 | 16,225 |
| 7 | Jackson | Cape Girardeau | 13,758 | 14,869 | 15,481 |
| 8 | West Plains | Howell | 11,986 | 12,285 | 12,184 |
| 9 | Festus | Jefferson | 11,599 | 11,938 | 12,722 |
| 10 | Kennett | Dunklin | 10,932 | 10,662 | 10,515 |
| Rank | County | Income (2008) |
|---|---|---|
| 1 | Cape Girardeau | $45,862 |
| 2 | Perry | $44,264 |
| 3 | Taney | $39,771 |
| 4 | Scott | $39,735 |
| 5 | St. Francois | $39,551 |
| 6 | Phelps | $37,243 |
| 7 | Bollinger | $36,744 |
| 8 | Butler | $34,422 |
| 9 | Stoddard | $33,120 |
| 10 | Dent | $32,991 |
| 11 | New Madrid | $32,758 |
| 12 | Washington | $32,001 |
| 13 | Howell | $31,761 |
| 14 | Reynolds | $31,546 |
| 15 | Ozark | $31,508 |
| 16 | Douglas | $31,335 |
| 17 | Iron | $31,276 |
| 18 | Madison | $31,137 |
| 19 | Dunklin | $30,927 |
| 20 | Wright | $30,685 |
| 21 | Texas | $29,260 |
| 22 | Wayne | $29,166 |
| 23 | Mississippi | $28,837 |
| 24 | Carter | $27,608 |
| 25 | Ripley | $27,285 |
| 26 | Pemiscot | $26,992 |
| 27 | Oregon | $26,119 |
| 28 | Shannon | $24,835 |
| Rank | County | Income (2008) |
|---|---|---|
| 1 | Cape Girardeau | $58,037 |
| 2 | Perry | $53,034 |
| 3 | Phelps | $49,343 |
| 4 | Scott | $48,847 |
| 5 | St. Francois | $47,923 |
| 6 | Taney | $47,664 |
| 7 | Bollinger | $42,948 |
| 8 | Butler | $42,713 |
| 9 | Stoddard | $41,072 |
| 10 | Dent | $40,258 |
| 11 | New Madrid | $39,411 |
| 12 | Dunklin | $38,439 |
| 13 | Washington | $38,193 |
| 14 | Madison | $38,067 |
| 15 | Howell | $38,047 |
| 16 | Iron | $38,037 |
| 17 | Reynolds | $37,891 |
| 18 | Wright | $37,139 |
| 19 | Douglas | $36,648 |
| 20 | Ozark | $36,622 |
| 21 | Mississippi | $35,554 |
| 22 | Wayne | $34,727 |
| 23 | Texas | $34,503 |
| 24 | Pemiscot | $33,945 |
| 25 | Carter | $33,349 |
| 26 | Ripley | $33,101 |
| 27 | Oregon | $31,637 |
| 28 | Shannon | $30,102 |
| County | George W. Bush | % | Al Gore | % | Ralph Nader | % | Others | % | Margin | % | Total |
|---|---|---|---|---|---|---|---|---|---|---|---|
| Bollinger | 3,487 | 65.87% | 1,692 | 31.96% | 41 | 0.77% | 74 | 1.40% | −1,795 | R+ 33.91% | 5,294 |
| Butler | 9,111 | 63.28% | 4,996 | 34.70% | 149 | 1.03% | 141 | 0.99% | −4,115 | R+ 28.58% | 14,397 |
| Cape Girardeau | 19,832 | 66.42% | 9,334 | 31.26% | 376 | 1.26% | 317 | 1.06% | −10,498 | R+ 35.16% | 29,859 |
| Carter | 1,730 | 61.61% | 997 | 35.51% | 40 | 1.42% | 41 | 1.46% | −733 | R+ 26.10% | 2,808 |
| Crawford | 4,754 | 57.26% | 3,350 | 40.35% | 100 | 1.20% | 98 | 1.19% | −1,404 | R+ 16.91% | 8,302 |
| Dent | 3,996 | 66.73% | 1,839 | 30.71% | 66 | 1.10% | 87 | 1.46% | −2,157 | R+ 36.02% | 5,988 |
| Dunklin | 5,426 | 51.55% | 4,947 | 47.00% | 78 | 0.74% | 74 | 0.70% | −479 | R+ 4.55% | 10,525 |
| Howell | 9,018 | 64.07% | 4,641 | 32.97% | 197 | 1.40% | 219 | 1.56% | −4,377 | R+ 31.10% | 14,075 |
| Iron | 2,237 | 50.68% | 2,044 | 46.31% | 64 | 1.45% | 69 | 1.56% | −193 | R+ 4.37% | 4,414 |
| Madison | 2,460 | 56.25% | 1,828 | 41.80% | 42 | 0.96% | 43 | 0.99% | −632 | R+ 14.45% | 4,373 |
| Mississippi | 2,395 | 45.93% | 2,756 | 52.85% | 29 | 0.56% | 35 | 0.67% | −361 | D+ 6.92% | 5,215 |
| New Madrid | 3,416 | 47.01% | 3,738 | 51.45% | 45 | 0.62% | 67 | 0.92% | −322 | D+ 4.44% | 7,266 |
| Oregon | 2,521 | 59.56% | 1,568 | 37.04% | 60 | 1.42% | 84 | 1.98% | −953 | R+ 22.52% | 4,233 |
| Pemiscot | 2,750 | 45.38% | 3,245 | 53.55% | 37 | 0.61% | 28 | 0.46% | −495 | D+ 8.17% | 6,060 |
| Perry | 4,667 | 67.61% | 2,085 | 30.20% | 70 | 1.01% | 81 | 1.17% | −2,582 | R+ 37.41% | 6,903 |
| Phelps | 9,444 | 58.49% | 6,262 | 38.78% | 253 | 1.57% | 187 | 1.16% | −3,182 | R+ 19.71% | 16,146 |
| Reynolds | 1,762 | 56.28% | 1,298 | 41.46% | 42 | 1.34% | 29 | 0.92% | −464 | R+ 14.82% | 3,131 |
| Ripley | 3,121 | 61.62% | 1,820 | 35.93% | 58 | 1.15% | 66 | 1.30% | −1,301 | R+ 25.69% | 5,065 |
| Scott | 8,999 | 57.30% | 6,452 | 41.09% | 113 | 0.72% | 130 | 0.83% | −2,547 | R+ 16.21% | 15,704 |
| Shannon | 2,245 | 59.38% | 1,430 | 37.82% | 48 | 1.27% | 58 | 1.53% | −815 | R+ 21.56% | 3,781 |
| St. Francois | 9,327 | 49.50% | 9,075 | 48.17% | 265 | 1.41% | 174 | 0.93% | −252 | R+ 1.33% | 18,841 |
| Stoddard | 7,727 | 62.04% | 4,476 | 35.94% | 114 | 0.92% | 137 | 1.10% | −3,251 | R+ 26.10% | 12,454 |
| Texas | 6,136 | 61.78% | 3,486 | 35.10% | 137 | 1.38% | 173 | 1.74% | −2,650 | R+ 26.68% | 9,932 |
| Washington | 4,020 | 48.64% | 4,047 | 48.97% | 95 | 1.15% | 103 | 1.25% | −27 | D+ 0.33% | 8,265 |
| Wayne | 3,346 | 57.22% | 2,387 | 40.82% | 55 | 0.94% | 60 | 1.03% | −959 | R+ 16.40% | 5,848 |
| Wright | 5,391 | 68.75% | 2,250 | 28.70% | 86 | 1.10% | 114 | 1.45% | −3,141 | R+ 40.05% | 7,841 |
| District Total | 139,318 | 58.85% | 92,043 | 38.88% | 2,660 | 1.12% | 2,689 | 1.14% | 47,275 | R+ 19.97% | 236,720 |
| County | George W. Bush | % | John Kerry | % | Others | % | Margin | % | Total |
|---|---|---|---|---|---|---|---|---|---|
| Bollinger | 4,102 | 69.58% | 1,754 | 29.75% | 39 | 0.63% | −2,348 | R+ 39.83% | 5,895 |
| Butler | 11,696 | 71.14% | 4,666 | 28.38% | 79 | 0.48% | −7,030 | R+ 42.76% | 16,441 |
| Cape Girardeau | 23,814 | 68.90% | 10,568 | 30.57% | 183 | 0.53% | −13,246 | R+ 38.33% | 34,565 |
| Carter | 1,797 | 64.66% | 964 | 34.69% | 18 | 0.64% | −833 | R+ 29.97% | 2,779 |
| Dent | 4,369 | 69.31% | 1,865 | 29.58% | 70 | 1.12% | −2,504 | R+ 39.73% | 6,304 |
| Douglas | 4,498 | 71.09% | 1,741 | 27.52% | 88 | 1.39% | −2,757 | R+ 43.57% | 6,327 |
| Dunklin | 6,720 | 57.55% | 4,901 | 41.97% | 56 | 0.48% | −1,819 | R+ 15.58% | 11,677 |
| Howell | 11,097 | 67.75% | 5,118 | 31.25% | 164 | 1.00% | −5,979 | R+ 36.50% | 16,379 |
| Iron | 2,477 | 52.94% | 2,157 | 46.10% | 45 | 0.96% | −320 | R+ 6.84% | 4,679 |
| Madison | 2,905 | 59.07% | 1,972 | 40.10% | 41 | 0.84% | −933 | R+ 18.97% | 4,918 |
| Mississippi | 2,903 | 54.79% | 2,374 | 44.81% | 21 | 0.40% | −529 | R+ 9.98% | 5,298 |
| New Madrid | 4,154 | 52.54% | 3,716 | 47.00% | 37 | 0.47% | −438 | R+ 5.54% | 7,907 |
| Oregon | 2,769 | 59.26% | 1,823 | 39.01% | 81 | 1.74% | −946 | R+ 20.25% | 4,673 |
| Ozark | 3,083 | 65.50% | 1,561 | 33.16% | 63 | 1.34% | −1,522 | R+ 32.34% | 4,707 |
| Pemiscot | 3,398 | 49.93% | 3,381 | 49.68% | 27 | 0.40% | −17 | R+ 0.25% | 6,806 |
| Perry | 5,583 | 67.70% | 2,621 | 31.78% | 43 | 0.52% | −2,962 | R+ 35.92% | 8,247 |
| Phelps | 11,874 | 63.50% | 6,666 | 35.65% | 160 | 0.75% | −5,208 | R+ 27.85% | 18,700 |
| Reynolds | 1,896 | 56.36% | 1,449 | 43.07% | 19 | 0.57% | −447 | R+ 13.29% | 3,364 |
| Ripley | 3,693 | 65.33% | 1,907 | 33.73% | 53 | 0.94% | −1,786 | R+ 31.60% | 5,653 |
| Scott | 11,330 | 64.94% | 6,057 | 34.71% | 61 | 0.35% | −5,273 | R+ 30.23% | 17,448 |
| Shannon | 2,511 | 60.26% | 1,618 | 38.83% | 38 | 0.92% | −893 | R+ 21.43% | 4,167 |
| St. Francois | 12,087 | 52.71% | 10,748 | 46.87% | 98 | 0.43% | −1,339 | R+ 5.84% | 22,933 |
| Stoddard | 9,242 | 69.74% | 3,946 | 29.78% | 64 | 0.48% | −5,296 | R+ 39.96% | 13,252 |
| Taney* | 3,496 | 67.53% | 1,644 | 31.76% | 37 | 0.71% | −1,852 | R+ 35.77% | 5,177 |
| Texas | 7,234 | 65.66% | 3,664 | 33.25% | 120 | 1.09% | −3,570 | R+ 32.41% | 11,018 |
| Washington | 4,641 | 50.57% | 4,459 | 48.58% | 78 | 0.84% | −182 | R+ 1.99% | 9,178 |
| Wayne | 3,919 | 63.17% | 2,250 | 36.27% | 35 | 0.57% | −1,669 | R+ 26.90% | 6,204 |
| Wright | 6,090 | 72.97% | 2,188 | 26.22% | 68 | 0.82% | −3,902 | R+ 46.75% | 8,346 |
| District Total | 173,378 | 63.50% | 97,778 | 35.81% | 1,886 | 0.69% | 75,600 | R+ 27.69% | 273,042 |
| County | John McCain | % | Barack Obama | % | Others | % | Margin | % | Total |
|---|---|---|---|---|---|---|---|---|---|
| Bollinger | 3,972 | 68.67% | 1,690 | 29.22% | 122 | 2.11% | −2,282 | R+ 39.45% | 5,784 |
| Butler | 11,805 | 68.09% | 5,316 | 30.66% | 217 | 1.25% | −6,489 | R+ 37.43% | 17,338 |
| Cape Girardeau | 24,768 | 66.30% | 12,208 | 32.68% | 379 | 1.01% | −12,560 | R+ 33.62% | 37,446 |
| Carter | 1,840 | 63.49% | 984 | 33.95% | 74 | 2.55% | −856 | R+ 29.54% | 2,898 |
| Dent | 4,655 | 67.78% | 2,056 | 29.94% | 157 | 2.29% | −2,599 | R+ 37.84% | 6,868 |
| Douglas | 4,405 | 65.63% | 2,140 | 31.88% | 167 | 2.49% | −2,265 | R+ 33.75% | 6,712 |
| Dunklin | 7,044 | 59.88% | 4,540 | 38.59% | 180 | 1.53% | −2,504 | R+ 21.29% | 11,764 |
| Howell | 10,982 | 64.49% | 5,736 | 33.68% | 311 | 1.83% | −5,246 | R+ 30.81% | 17,029 |
| Iron | 2,090 | 47.35% | 2,213 | 50.14% | 111 | 2.51% | −123 | D+ 2.79% | 4,414 |
| Madison | 2,897 | 57.62% | 2,042 | 40.61% | 89 | 1.77% | −855 | R+ 17.01% | 5,028 |
| Mississippi | 3,034 | 56.65% | 2,247 | 41.95% | 75 | 1.40% | −787 | R+ 14.70% | 5,356 |
| New Madrid | 4,593 | 56.76% | 3,370 | 41.65% | 129 | 1.59% | −1,223 | R+ 15.11% | 8,092 |
| Oregon | 2,652 | 57.77% | 1,811 | 39.45% | 128 | 2.78% | −841 | R+ 18.32% | 4,591 |
| Ozark | 2,918 | 62.27% | 1,661 | 35.45% | 107 | 2.28% | −1,257 | R+ 26.82% | 4,686 |
| Pemiscot | 3,954 | 56.11% | 3,029 | 42.98% | 64 | 0.91% | −925 | R+ 13.13% | 7,047 |
| Perry | 5,527 | 63.92% | 3,005 | 34.75% | 115 | 1.33% | −2,522 | R+ 29.17% | 8,647 |
| Phelps | 11,706 | 60.22% | 7,394 | 38.04% | 338 | 1.74% | −4,312 | R+ 22.18% | 19,524 |
| Reynolds | 1,782 | 54.21% | 1,418 | 43.14% | 87 | 2.65% | −364 | R+ 11.07% | 3,287 |
| Ripley | 3,407 | 63.53% | 1,795 | 33.47% | 161 | 3.00% | −1,612 | R+ 30.06% | 5,363 |
| Scott | 11,563 | 64.15% | 6,258 | 34.72% | 205 | 1.13% | −5,305 | R+ 29.43% | 18,082 |
| Shannon | 2,075 | 54.06% | 1,637 | 42.65% | 126 | 3.29% | −438 | R+ 11.41% | 3,838 |
| St. Francois | 12,660 | 51.57% | 11,540 | 47.01% | 350 | 1.42% | −1,120 | R+ 4.56% | 24,550 |
| Stoddard | 9,172 | 69.16% | 3,899 | 29.40% | 191 | 1.44% | −5,273 | R+ 39.76% | 13,262 |
| Taney* | 2,138 | 67.62% | 979 | 30.96% | 45 | 1.42% | −1,159 | R+ 36.66% | 3,162 |
| Texas | 7,215 | 66.49% | 3,410 | 31.43% | 226 | 2.08% | −3,805 | R+ 35.06% | 10,851 |
| Washington | 4,706 | 48.95% | 4,711 | 49.00% | 197 | 2.05% | −5 | D+ 0.05% | 9,614 |
| Wayne | 3,784 | 61.49% | 2,243 | 36.45% | 127 | 2.06% | −1,541 | R+ 25.04% | 6,154 |
| Wright | 5,784 | 67.94% | 2,557 | 30.03% | 173 | 2.03% | −3,227 | R+ 37.91% | 8,514 |
| District Total | 174,564 | 61.92% | 102,682 | 36.42% | 4,688 | 1.66% | 71,882 | R+ 25.50% | 281,934 |
| County | Mitt Romney | % | Barack Obama | % | Others | % | Margin | % | Total |
|---|---|---|---|---|---|---|---|---|---|
| Bollinger | 4,095 | 75.05% | 1,213 | 22.23% | 148 | 2.72% | −2,882 | R+ 52.82% | 5,456 |
| Butler | 12,248 | 72.52% | 4,363 | 25.83% | 278 | 1.65% | −7,885 | R+ 46.69% | 16,889 |
| Cape Girardeau | 25,370 | 70.81% | 9,728 | 27.15% | 731 | 2.04% | −15,642 | R+ 43.66% | 35,829 |
| Carter | 1,978 | 70.67% | 754 | 26.94% | 67 | 2.39% | −1,224 | R+ 43.73% | 2,799 |
| Crawford | 6,434 | 67.17% | 2,951 | 30.81% | 194 | 2.03% | −3,483 | R+ 36.36% | 9,579 |
| Dent | 4,883 | 73.51% | 1,585 | 23.86% | 175 | 2.63% | −3,298 | R+ 49.65% | 6,671 |
| Douglas | 4,649 | 70.90% | 1,710 | 26.08% | 198 | 3.02% | −2,939 | R+ 44.82% | 6,557 |
| Dunklin | 6,850 | 64.31% | 3,636 | 34.14% | 165 | 1.55% | −3,214 | R+ 30.17% | 10,651 |
| Howell | 11,544 | 70.62% | 4,395 | 26.89% | 407 | 2.49% | −7,149 | R+ 43.73% | 16,346 |
| Iron | 2,252 | 55.87% | 1,669 | 41.40% | 110 | 2.73% | −583 | R+ 14.47% | 4,031 |
| Jefferson* | 14,608 | 55.18% | 11,277 | 42.59% | 591 | 2.23% | −3,331 | R+ 12.59% | 26,476 |
| Madison | 3,227 | 65.46% | 1,588 | 32.21% | 115 | 2.33% | −1,639 | R+ 33.25% | 4,930 |
| Mississippi | 2,997 | 60.91% | 1,858 | 37.76% | 65 | 1.33% | −1,139 | R+ 23.15% | 4,920 |
| New Madrid | 4,284 | 59.09% | 2,814 | 38.81% | 152 | 2.10% | −1,470 | R+ 20.28% | 7,250 |
| Oregon | 2,886 | 65.28% | 1,419 | 32.10% | 116 | 2.62% | −1,467 | R+ 33.18% | 4,421 |
| Ozark | 3,080 | 69.17% | 1,261 | 28.32% | 112 | 2.51% | −1,819 | R+ 40.85% | 4,453 |
| Pemiscot | 3,598 | 56.80% | 2,671 | 42.16% | 66 | 1.04% | −927 | R+ 14.64% | 6,335 |
| Perry | 5,669 | 70.98% | 2,184 | 27.34% | 134 | 1.68% | −3,485 | R+ 43.64% | 7,987 |
| Phelps | 11,895 | 65.05% | 5,798 | 31.71% | 593 | 3.24% | −6,097 | R+ 33.34% | 18,286 |
| Reynolds | 1,931 | 60.31% | 1,157 | 36.13% | 114 | 3.56% | −774 | R+ 24.18% | 3,202 |
| Ripley | 3,743 | 71.12% | 1,396 | 26.52% | 124 | 2.36% | −2,347 | R+ 44.60% | 5,263 |
| Scott | 11,623 | 68.37% | 5,122 | 30.13% | 254 | 1.50% | −6,501 | R+ 38.24% | 16,999 |
| Shannon | 2,262 | 61.27% | 1,302 | 35.27% | 128 | 3.46% | −960 | R+ 26.00% | 3,692 |
| St. Francois | 13,248 | 58.67% | 8,829 | 39.10% | 505 | 2.23% | −4,419 | R+ 19.57% | 22,705 |
| Ste. Genevieve | 4,055 | 50.25% | 3,813 | 47.25% | 202 | 2.50% | −242 | R+ 3.00% | 8,070 |
| Stoddard | 9,496 | 73.81% | 3,153 | 24.51% | 217 | 1.68% | −6,343 | R+ 49.30% | 12,866 |
| Texas | 7,618 | 70.77% | 2,871 | 26.67% | 275 | 2.56% | −4,747 | R+ 44.10% | 10,764 |
| Washington | 5,071 | 58.32% | 3,417 | 39.30% | 207 | 2.38% | −1,654 | R+ 19.02% | 8,695 |
| Wayne | 3,790 | 66.26% | 1,813 | 31.70% | 117 | 2.04% | −1,977 | R+ 34.56% | 5,720 |
| Wright | 5,830 | 73.29% | 1,953 | 24.55% | 172 | 2.16% | −3,877 | R+ 48.74% | 7,955 |
| District Total | 201,214 | 65.88% | 97,700 | 31.99% | 6,523 | 2.13% | 103,514 | R+ 33.89% | 305,437 |
| County | Hillary Clinton | % | Barack Obama | % | John Edwards | % | Others | % | Margin | % | Total |
|---|---|---|---|---|---|---|---|---|---|---|---|
| Bollinger | 971 | 74.12% | 293 | 22.37% | 38 | 2.90% | 8 | 0.61% | −678 | C+ 51.75% | 1,310 |
| Butler | 2,490 | 69.87% | 960 | 26.94% | 82 | 2.30% | 32 | 0.90% | −1,530 | C+ 42.93% | 3,564 |
| Cape Girardeau | 4,510 | 56.55% | 3,145 | 39.44% | 247 | 3.10% | 73 | 0.92% | −1,365 | C+ 17.11% | 7,975 |
| Carter | 541 | 75.24% | 137 | 19.05% | 32 | 4.45% | 5 | 0.70% | −404 | C+ 56.19% | 719 |
| Dent | 962 | 62.23% | 493 | 31.89% | 74 | 4.79% | 17 | 1.10% | −469 | C+ 30.34% | 1,546 |
| Douglas | 827 | 62.32% | 454 | 34.21% | 39 | 2.94% | 7 | 0.53% | −373 | C+ 28.11% | 1,327 |
| Dunklin | 2,587 | 78.44% | 604 | 18.31% | 69 | 2.09% | 38 | 1.15% | −1,983 | C+ 60.13% | 3,298 |
| Howell | 2,307 | 64.07% | 1,168 | 32.44% | 99 | 2.75% | 27 | 0.75% | −1,139 | C+ 31.63% | 3,601 |
| Iron | 1,180 | 70.53% | 406 | 24.27% | 72 | 4.30% | 15 | 0.90% | −774 | C+ 46.26% | 1,673 |
| Madison | 971 | 68.72% | 344 | 24.35% | 64 | 4.53% | 34 | 2.40% | −627 | C+ 44.37% | 1,413 |
| Mississippi | 1,094 | 65.43% | 502 | 30.02% | 57 | 3.41% | 19 | 1.14% | −592 | C+ 35.41% | 1,672 |
| New Madrid | 1,801 | 71.19% | 610 | 24.11% | 101 | 3.99% | 18 | 0.71% | −1,191 | C+ 47.08% | 2,530 |
| Oregon | 989 | 71.77% | 332 | 24.09% | 42 | 3.05% | 15 | 1.09% | −657 | C+ 47.68% | 1,378 |
| Ozark | 689 | 65.62% | 332 | 31.62% | 18 | 1.71% | 11 | 1.05% | −357 | C+ 34.00% | 1,050 |
| Pemiscot | 1,270 | 70.83% | 466 | 25.99% | 34 | 1.90% | 23 | 1.28% | −804 | C+ 44.84% | 1,793 |
| Perry | 1,180 | 61.24% | 650 | 33.73% | 81 | 4.20% | 16 | 0.83% | −530 | C+ 27.51% | 1,927 |
| Phelps | 2,392 | 53.93% | 1,878 | 42.34% | 122 | 2.75% | 43 | 0.97% | −514 | C+ 11.59% | 4,435 |
| Reynolds | 741 | 66.22% | 277 | 24.75% | 70 | 6.26% | 31 | 2.77% | −464 | C+ 41.47% | 1,119 |
| Ripley | 1,073 | 74.20% | 282 | 19.50% | 72 | 4.98% | 19 | 1.31% | −791 | C+ 54.70% | 1,446 |
| Scott | 2,931 | 63.43% | 1,443 | 31.23% | 191 | 4.13% | 56 | 1.22% | −1,488 | C+ 32.20% | 4,621 |
| Shannon | 914 | 69.72% | 323 | 24.64% | 50 | 3.81% | 24 | 1.83% | −591 | C+ 45.08% | 1,311 |
| St. Francois | 5,418 | 70.25% | 1,993 | 25.84% | 224 | 2.90% | 78 | 1.01% | −3,425 | C+ 44.41% | 7,713 |
| Stoddard | 2,225 | 72.95% | 684 | 22.43% | 112 | 3.67% | 29 | 0.95% | −1,541 | C+ 50.52% | 3,050 |
| Taney* | 1,219 | 62.51% | 674 | 34.56% | 39 | 2.00% | 18 | 0.92% | −545 | C+ 27.95% | 1,950 |
| Texas | 1,858 | 68.03% | 743 | 27.21% | 101 | 3.70% | 29 | 1.06% | −1,115 | C+ 40.82% | 2,731 |
| Washington | 2,345 | 74.63% | 670 | 21.32% | 100 | 3.18% | 27 | 0.86% | −1,675 | C+ 53.31% | 3,142 |
| Wayne | 1,458 | 75.94% | 359 | 18.70% | 71 | 3.70% | 32 | 1.66% | −1,099 | C+ 57.24% | 1,920 |
| Wright | 1,143 | 69.48% | 452 | 27.48% | 36 | 2.19% | 14 | 0.85% | −691 | C+ 42.00% | 1,645 |
| District Total | 48,086 | 66.92% | 20,674 | 28.77% | 2,337 | 3.25% | 762 | 1.06% | 27,412 | C+ 38.15% | 71,859 |
| County | Mike Huckabee | % | John McCain | % | Mitt Romney | % | Ron Paul | % | Others | % | Margin | % | Total |
|---|---|---|---|---|---|---|---|---|---|---|---|---|---|
| Bollinger | 657 | 39.72% | 518 | 31.32% | 384 | 23.22% | 65 | 3.93% | 30 | 1.81% | −139 | H+ 8.04% | 1,654 |
| Butler | 2,215 | 48.85% | 1,117 | 24.64% | 1,007 | 22.21% | 134 | 2.96% | 61 | 1.35% | −1,098 | H+ 24.21% | 4,534 |
| Cape Girardeau | 3,068 | 27.63% | 3,528 | 31.77% | 3,922 | 35.32% | 361 | 3.25% | 226 | 2.04% | −394 | R+ 3.55% | 11,105 |
| Carter | 373 | 52.39% | 202 | 28.37% | 107 | 15.03% | 24 | 3.37% | 6 | 0.84% | −171 | H+ 24.02% | 712 |
| Dent | 959 | 48.78% | 442 | 22.48% | 411 | 20.91% | 127 | 6.46% | 27 | 1.37% | −517 | H+ 26.30% | 1,966 |
| Douglas | 1,343 | 55.04% | 516 | 21.15% | 270 | 11.07% | 295 | 12.09% | 16 | 0.66% | −827 | H+ 33.89% | 2,440 |
| Dunklin | 1,309 | 58.52% | 480 | 21.46% | 381 | 17.03% | 36 | 1.61% | 31 | 1.39% | −829 | H+ 37.06% | 2,237 |
| Howell | 2,882 | 52.97% | 1,347 | 24.76% | 793 | 14.57% | 356 | 6.54% | 63 | 1.16% | −1,535 | H+ 28.21% | 5,441 |
| Iron | 354 | 43.17% | 269 | 32.80% | 138 | 16.83% | 43 | 5.24% | 16 | 1.95% | −85 | H+ 10.37% | 820 |
| Madison | 560 | 43.96% | 452 | 35.48% | 185 | 14.52% | 51 | 4.00% | 26 | 2.04% | −108 | H+ 8.48% | 1,274 |
| Mississippi | 471 | 42.59% | 373 | 33.73% | 226 | 20.43% | 15 | 1.36% | 21 | 1.90% | −98 | H+ 8.86% | 1,106 |
| New Madrid | 656 | 48.74% | 386 | 28.68% | 250 | 18.57% | 43 | 3.19% | 11 | 0.82% | −270 | H+ 20.06% | 1,346 |
| Oregon | 696 | 58.88% | 242 | 20.47% | 134 | 11.34% | 101 | 8.54% | 9 | 0.76% | −454 | H+ 38.41% | 1,182 |
| Ozark | 766 | 48.09% | 428 | 26.87% | 235 | 14.75% | 149 | 9.35% | 15 | 0.94% | −338 | H+ 21.22% | 1,593 |
| Pemiscot | 565 | 57.59% | 233 | 23.75% | 149 | 15.19% | 20 | 2.04% | 14 | 1.43% | −332 | H+ 33.84% | 981 |
| Perry | 575 | 25.76% | 973 | 43.59% | 542 | 24.28% | 96 | 4.30% | 46 | 2.06% | −398 | M+ 17.83% | 2,232 |
| Phelps | 1,728 | 35.15% | 1,459 | 29.68% | 1,340 | 27.26% | 321 | 6.53% | 68 | 1.38% | −269 | H+ 5.47% | 4,916 |
| Reynolds | 283 | 46.09% | 202 | 32.90% | 93 | 15.15% | 25 | 4.07% | 11 | 1.79% | −81 | H+ 13.19% | 614 |
| Ripley | 750 | 53.84% | 329 | 23.62% | 238 | 17.09% | 52 | 3.73% | 24 | 1.72% | −421 | H+ 30.22% | 1,393 |
| Scott | 1,549 | 36.79% | 1,389 | 32.99% | 1,076 | 25.56% | 113 | 2.68% | 83 | 1.97% | −160 | H+ 3.80% | 4,210 |
| Shannon | 515 | 54.44% | 223 | 23.57% | 83 | 8.77% | 109 | 11.52% | 16 | 1.69% | −292 | H+ 30.87% | 946 |
| St. Francois | 1,631 | 35.90% | 1,727 | 38.01% | 949 | 20.89% | 134 | 2.95% | 102 | 2.25% | −96 | M+ 2.11% | 4,543 |
| Stoddard | 1,571 | 50.56% | 772 | 24.85% | 643 | 20.70% | 91 | 2.93% | 30 | 0.97% | −799 | H+ 25.71% | 3,107 |
| Taney* | 1,821 | 55.89% | 844 | 25.91% | 462 | 14.18% | 92 | 2.82% | 40 | 1.23% | −977 | H+ 29.98% | 3,258 |
| Texas | 1,727 | 50.13% | 954 | 27.69% | 480 | 13.93% | 234 | 6.79% | 50 | 1.45% | −773 | H+ 22.44% | 3,445 |
| Washington | 622 | 38.73% | 616 | 38.36% | 297 | 18.49% | 50 | 3.11% | 21 | 1.31% | −6 | H+ 0.37% | 1,606 |
| Wayne | 740 | 45.20% | 499 | 30.48% | 323 | 19.73% | 46 | 2.81% | 29 | 1.77% | −241 | H+ 14.72% | 1,637 |
| Wright | 1,878 | 59.64% | 746 | 23.69% | 298 | 9.46% | 178 | 5.65% | 49 | 1.56% | −1,132 | H+ 35.95% | 3,149 |
| District Total | 32,264 | 43.93% | 21,266 | 28.95% | 15,416 | 20.99% | 3,361 | 4.58% | 1,141 | 1.55% | 10,998 | H+ 14.98% | 73,447 |
|
| |
|---|---|
|
37°11′39″N 90°56′04″W / 37.19417°N 90.93444°W / 37.19417; -90.93444