Jump to content


Main menu


Navigation  


Main page
Contents
Current events
Random article
About Wikipedia
Contact us
Donate


Contribute  


Help
Learn to edit
Community portal
Recent changes
Upload file


Search  


Create account

Log in


Create account
 Log in


Pages for logged out editors learn more  


Contributions
Talk


Contents


(Top)


1 Results  


2 References  


3 External links  


2001 Northumberland County Council election


Add links


Article
Talk


Read
Edit
View history


Tools


Actions  


Read
Edit
View history


General  


What links here
Related changes
Upload file
Special pages
Permanent link
Page information
Cite this page
Get shortened URL
Download QR code
Wikidata item


Print/export  


Download as PDF
Printable version


Appearance


From Wikipedia, the free encyclopedia


2001 Northumberland County Council election[1]

← 1997 7 June 2001 (2001-06-07) 2005 →

All 67 seats
toNorthumberland County Council
34 seats needed for a majority
Turnout61.6%
  First party Second party
 
Party Labour Conservative
Last election 43 13
Seats won 38 17
Seat change Decrease5 Increase4
Popular vote 60,944 36,801
Percentage 40.7% 24.5%

  Third party Fourth party
 
Party Liberal Democrats Independent
Last election 8 2
Seats won 9 3
Seat change Increase1 Increase1
Popular vote 44,502 6,953
Percentage 29.7% 4.6%

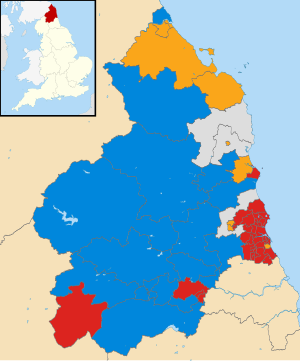
Map of the results of the 2001 local election.


Control of Council before election


Labour Party

Control of Council after election


Labour Party

Local electionstoNorthumberland County Council, a county council in the north east of England, were held on 7 June 2001. It was the first election to be held under new ward boundaries that increased the number of seats from 66 to 67.[2] The Labour Party retained overall control of the council.

Results[edit]

Northumberland County Council election, 2001[3]
Party Seats Gains Losses Net gain/loss Seats % Votes % Votes +/−
  Labour 38 40.7 Decrease4.1
  Conservative 17 24.5 Increase0.2
  Liberal Democrats 9 29.7 Increase3.7
  Independent 3 4.6 Increase0.9
  Green 0 0.0 0.5 Decrease0.2

References[edit]

  1. ^ "Local Election Summaries 2001". The Elections Centre. Retrieved 21 June 2019.
  • ^ "Vote 2001". BBC News.
  • ^ p.11
  • External links[edit]


    Retrieved from "https://en.wikipedia.org/w/index.php?title=2001_Northumberland_County_Council_election&oldid=1224498462"

    Categories: 
    Northumberland County Council elections
    2001 English local elections
    21st century in Northumberland
    Hidden categories: 
    Articles with short description
    Short description matches Wikidata
    Use dmy dates from March 2020
    Use British English from March 2020


    This page was last edited on 18 May 2024, at 19:47 (UTC).

    Text is available under the Creative Commons Attribution-ShareAlike License 4.0; additional terms may apply. By using this site, you agree to the Terms of Use and Privacy Policy. Wikipedia® is a registered trademark of the Wikimedia Foundation, Inc., a non-profit organization.


    Privacy policy

    About Wikipedia

    Disclaimers

    Contact Wikipedia

    Code of Conduct

    Developers

    Statistics

    Cookie statement

    Mobile view


    Wikimedia Foundation
    Powered by MediaWiki