Jump to content


Main menu


Navigation  


Main page
Contents
Current events
Random article
About Wikipedia
Contact us
Donate


Contribute  


Help
Learn to edit
Community portal
Recent changes
Upload file


Search  


Create account

Log in


Create account
 Log in


Pages for logged out editors learn more  


Contributions
Talk


Contents


(Top)


1 Construction  


2 References  


3 Sources  


Biplot


Español
فارسی
Português


Edit links


Article
Talk


Read
Edit
View history


Tools


Actions  


Read
Edit
View history


General  


What links here
Related changes
Upload file
Special pages
Permanent link
Page information
Cite this page
Get shortened URL
Download QR code
Wikidata item


Print/export  


Download as PDF
Printable version


In other projects  


Wikimedia Commons


Appearance


From Wikipedia, the free encyclopedia


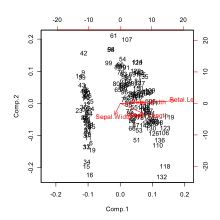
Biplot of Fisher's iris data set. The scattered points are the input scores of observations and the arrows show the contribution of each feature to the input loading vectors.
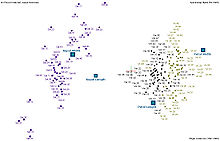
Spectramap biplot of Anderson's iris data set
Discriminant analysis biplot of Fisher's iris data (Greenacre, 2010)

Biplots are a type of exploratory graph used in statistics, a generalization of the simple two-variable scatterplot. A biplot overlays a score plot with a loading plot. A biplot allows information on both samples and variables of a data matrix to be displayed graphically. Samples are displayed as points while variables are displayed either as vectors, linear axes or nonlinear trajectories. In the case of categorical variables, category level points may be used to represent the levels of a categorical variable. A generalised biplot displays information on both continuous and categorical variables.

The biplot was introduced by K. Ruben Gabriel (1971).[1]

Construction[edit]

A biplot is constructed by using the singular value decomposition (SVD) to obtain a low-rank approximation to a transformed version of the data matrix X, whose n rows are the samples (also called the cases, or objects), and whose p columns are the variables. The transformed data matrix Y is obtained from the original matrix X by centering and optionally standardizing the columns (the variables). Using the SVD, we can write Y = Σk=1,...pdkukvkT;, where the uk are n-dimensional column vectors, the vk are p-dimensional column vectors, and the dk are a non-increasing sequence of non-negative scalars. The biplot is formed from two scatterplots that share a common set of axes and have a between-set scalar product interpretation. The first scatterplot is formed from the points (d1αu1i,  d2αu2i), for i = 1,...,n. The second plot is formed from the points (d11−αv1jd21−αv2j), for j = 1,...,p. This is the biplot formed by the dominant two terms of the SVD, which can then be represented in a two-dimensional display. Typical choices of α are 1 (to give a distance interpretation to the row display) and 0 (to give a distance interpretation to the column display), and in some rare cases α=1/2 to obtain a symmetrically scaled biplot (which gives no distance interpretation to the rows or the columns, but only the scalar product interpretation). The set of points depicting the variables can be drawn as arrows from the origin to reinforce the idea that they represent biplot axes onto which the samples can be projected to approximate the original data.

References[edit]

  1. ^ 'Gabriel, K. R. (1971). The biplot graphic display of matrices with application to principal component analysis. Biometrika, 58(3), 453–467.

Sources[edit]


Retrieved from "https://en.wikipedia.org/w/index.php?title=Biplot&oldid=1231606870"

Categories: 
Statistical charts and diagrams
Factor analysis
Hidden categories: 
Articles with short description
Short description matches Wikidata


This page was last edited on 29 June 2024, at 06:47 (UTC).

Text is available under the Creative Commons Attribution-ShareAlike License 4.0; additional terms may apply. By using this site, you agree to the Terms of Use and Privacy Policy. Wikipedia® is a registered trademark of the Wikimedia Foundation, Inc., a non-profit organization.


Privacy policy

About Wikipedia

Disclaimers

Contact Wikipedia

Code of Conduct

Developers

Statistics

Cookie statement

Mobile view


Wikimedia Foundation
Powered by MediaWiki