Jump to content


Main menu


Navigation  


Main page
Contents
Current events
Random article
About Wikipedia
Contact us
Donate


Contribute  


Help
Learn to edit
Community portal
Recent changes
Upload file


Search  


Create account

Log in


Create account
 Log in


Pages for logged out editors learn more  


Contributions
Talk


Contents


(Top)


1 Political history  


2 Recent statewide election results  


3 List of members representing the district  


4 Election results  


4.1  1982  


4.2  1984  


4.3  1986  


4.4  1988  


4.5  1990  


4.6  1992  


4.7  1994  


4.8  1996  


4.9  1998  


4.10  2000  


4.11  2002  


4.12  2004  


4.13  2006  


4.14  2008  


4.15  2010  


4.16  2011 (special)  


4.17  2012  


4.18  2014  


4.19  2016  


4.20  2018  


4.21  2020  


4.22  2022  


5 Historical district boundaries  


6 See also  


7 Notes  


8 References  


Nevada's 2nd congressional district


Español
فارسی
Français
Nederlands


Edit links


Article
Talk


Read
Edit
View history


Tools


Actions  


Read
Edit
View history


General  


What links here
Related changes
Upload file
Special pages
Permanent link
Page information
Cite this page
Get shortened URL
Download QR code
Wikidata item


Print/export  


Download as PDF
Printable version


In other projects  


Wikimedia Commons


Appearance


Coordinates: 40°3904N 117°1947W / 40.65111°N 117.32972°W / 40.65111; -117.32972
 

From Wikipedia, the free encyclopedia


Nevada's 2nd congressional district

Map

Map

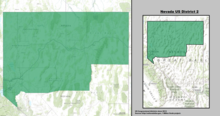
Interactive map of district boundaries. Points indicate major cities in the district with a population over 50,000, ordered by population (Reno, Sparks, and Carson City).
Representative

Mark Amodei
RCarson City

Population (2022)791,398
Median household
income
$79,687[1]
Ethnicity
  • 23.1% Hispanic
  • 5.1% Two or more races
  • 4.2% Asian
  • 1.9% Black
  • 1.7% Native American
  • 1.0% other
  • Cook PVIR+8[2]

    Nevada's 2nd congressional district is a congressional district that includes the northern third of the state. It includes most of Lyon County, all of Churchill, Douglas, Elko, Eureka, Humboldt, Lander, Pershing, Storey, Washoe, and White Pine counties, as well as the state capital, Carson City. The largest city in the district is Reno, the state's third largest city. Although the district appears rural, its politics are dominated by Reno and Carson City. As of 2017, over 460,000 people reside in Washoe County alone, totaling about two-thirds of the district's population. With a Cook Partisan Voting Index rating of R+8, it is the only Republican-leaning congressional district in Nevada.[2]

    Political history[edit]

    The district was initially created after the redistricting cycle after the 1980 census, when Nevada was split into districts for the first time. From then until 2013, it occupied all of the state outside of Clark County. From 1993 to 2013, it also included the far northern portion of Clark County. Until 2013, it was the third-largest congressional district by land area that did not cover an entire state. Even though it lost much of its southern portion to the new 4th District after the 2010 census, it is still the fifth-largest district in the nation that does not cover an entire state.

    The 2nd district has always leaned Republican. It has been represented by only four people since its creation, all Republicans. Democrats have only made four serious bids for the seat. In presidential elections, the district has historically voted Republican; George W. Bush won the district by 20 points in 2000 and 16 points in 2004. However, in the 2008 election John McCain earned only 88 votes more (out of 335,720 votes) than Barack Obama in the district.

    On April 21, 2011, U.S. Senator John Ensign (R-Nev.), plagued by scandal and facing an inquiry by the Senate Ethics Committee, announced his resignation effective May 3.[3] On April 27, Governor Brian Sandoval announced he would appoint Dean Heller, the 2nd district's third-term congressman, to fill out Ensign's term in the Senate. Heller had already planned to run for the seat after Ensign announced a month earlier that he would not run for a third term. To fill the vacancy created by Heller's resignation on May 9, Sandoval was required to call a special election to be held within six months of the occurrence of the vacancy.[4]

    A special election was held on September 13, 2011. Former Republican state senator Mark Amodei defeated Democratic State Treasurer Kate Marshall.[5]

    Recent statewide election results[edit]

    Election results from presidential and statewide races

    Year Office Result
    2016 President Trump 52.5% – 39.2%
    Senator Heck 53.3% – 39.1%
    2018 Senator Heller 53.7% – 42.0%
    Governor Laxalt 53.7% – 40.8%
    Lieutenant Governor Roberson 49.9% – 43.7%
    Attorney General Duncan 54.9% – 37.9%
    2020 President Trump 54.1% – 43.1%
    2022 Senator Laxalt 53.9% – 42.7%
    Governor Lombardo 54.2% – 41.4%
    Lieutenant Governor Anthony 55.2% – 39.3%
    Attorney General Chattah 48.3% – 47.5%
    Results under old lines (2013-2023)
    Results under old lines (2003-2013)[6]
    Results under old lines (1983-1993;1993-2003)

    List of members representing the district[edit]

    Member
    (Residency)
    Party Years Cong
    ress
    Electoral history District location
    District established January 3, 1983

    Barbara Vucanovich
    (Reno)
    Republican January 3, 1983 –
    January 3, 1997
    98th
    99th
    100th
    101st
    102nd
    103rd
    104th
    Elected in 1982.
    Re-elected in 1984.
    Re-elected in 1986.
    Re-elected in 1988.
    Re-elected in 1990.
    Re-elected in 1992.
    Re-elected in 1994.
    Retired.
    1983–1993
    Carson City, Churchill, Douglas, Elko, Esmeralda, Eureka, Humboldt, Lander, Lincoln, Lyon, Mineral, Nye, Pershing, Storey, Washoe, and White Pine; part of Clark
    1993–2003
    Carson City, Churchill, Douglas, Elko, Esmeralda, Eureka, Humboldt, Lander, Lincoln, Lyon, Mineral, Nye, Pershing, Storey, Washoe, and White Pine; part of Clark

    Jim Gibbons
    (Reno)
    Republican January 3, 1997 –
    December 31, 2006
    105th
    106th
    107th
    108th
    109th
    Elected in 1996.
    Re-elected in 1998.
    Re-elected in 2000.
    Re-elected in 2002.
    Re-elected in 2004.
    Resigned after elected Governor of Nevada.
    2003–2013

    Carson City, Churchill, Douglas, Elko, Esmeralda, Eureka, Humboldt, Lander, Lincoln, Lyon, Mineral, Nye, Pershing, Storey, Washoe, and White Pine; part of Clark
    Vacant December 31, 2006 –
    January 3, 2007
    109th

    Dean Heller
    (Carson City)
    Republican January 3, 2007 –
    May 9, 2011
    110th
    111th
    112th
    Elected in 2006.
    Re-elected in 2008.
    Re-elected in 2010.
    Resigned when appointed U.S. senator.
    Vacant May 9, 2011 –
    September 13, 2011
    112th

    Mark Amodei
    (Carson City)
    Republican September 13, 2011 –
    present
    112th
    113th
    114th
    115th
    116th
    117th
    118th
    Elected to finish Heller's term.
    Re-elected in 2012.
    Re-elected in 2014.
    Re-elected in 2016.
    Re-elected in 2018.
    Re-elected in 2020.
    Re-elected in 2022.
    2013–2023

    Carson City, Churchill, Douglas, Elko, Eureka, Humboldt, Lander, Pershing, Storey, and Washoe; part of Lyon
    2023–present

    Carson City, Douglas, Elko, Eureka, Humboldt, Lander, Pershing, Storey, Washoe, and White Pine; parts of Churchill, Lincoln, and Lyon

    Election results[edit]

    1982[edit]

    1982 election[7]
    Party Candidate Votes %
    Republican Barbara Vucanovich 70,188 55.49
    Democratic Mary Gojack 52,265 41.32
    Libertarian Teresa Vuceta 4,043 3.20
    Total votes 126,496 100.0
    Republican win (new seat)

    1984[edit]

    1984 election[8]
    Party Candidate Votes %
    Republican Barbara Vucanovich (Incumbent) 99,775 71.21
    Democratic Andrew Barbano 36,130 25.79
    Libertarian Dan Becan 4,201 3.00
    Total votes 140,106 100.0
    Republican hold

    1986[edit]

    1986 election[9]
    Party Candidate Votes %
    Republican Barbara Vucanovich (Incumbent) 83,479 58.41
    Democratic Pete Sferrazza 59,433 41.59
    Total votes 142,912 100.0
    Republican hold

    1988[edit]

    1988 election[10]
    Party Candidate Votes %
    Republican Barbara Vucanovich (Incumbent) 105,981 57.26
    Democratic Jim Spoo 75,163 40.61
    Libertarian Kent Cromwell 3,953 2.14
    Total votes 185,097 100.0
    Republican hold

    1990[edit]

    1990 election[11]
    Party Candidate Votes %
    Republican Barbara Vucanovich (Incumbent) 103,508 59.08
    Democratic Jane Wisdom 59,581 34.01
    Libertarian Dan Becan 12,120 6.92
    Total votes 175,209 100.0
    Republican hold

    1992[edit]

    1992 election[12]
    Party Candidate Votes %
    Republican Barbara Vucanovich (Incumbent) 129,575 47.91
    Democratic Pete Sferrazza 117,199 43.33
    Independent American Daniel M. Hansen 13,285 4.91
    Libertarian Dan Becan 7,552 2.79
    Populist Don Golden 2,850 1.05
    Total votes 270,461 100.0
    Republican hold

    1994[edit]

    1994 election[13]
    Party Candidate Votes %
    Republican Barbara Vucanovich (Incumbent) 142,202 63.50
    Democratic Janet Greeson 65,390 29.20
    Independent American Thomas F. Jefferson 9,615 4.29
    Natural Law Lois Avery 6,725 3.00
    Total votes 223,932 100.0
    Republican hold

    1996[edit]

    1996 election[14]
    Party Candidate Votes %
    Republican Jim Gibbons 162,310 58.56
    Democratic Thomas "Spike" Wilson 97,942 35.26
    Independent American Daniel M. Hansen 8,780 3.17
    Natural Law Lois Avery 4,628 1.67
    Libertarian Louis R. Tomburello 3,732 1.35
    Total votes 277,192 100.0
    Republican hold

    1998[edit]

    1998 election[15]
    Party Candidate Votes %
    Republican Jim Gibbons (Incumbent) 201,623 81.05
    Independent American Christopher Horne 20,738 8.34
    Libertarian Louis R. Tomburello 18,561 7.46
    Natural Law Robert W. Winquist 7,841 3.15
    Total votes 248,763 100.0
    Republican hold

    2000[edit]

    2000 election[16]
    Party Candidate Votes %
    Republican Jim Gibbons (Incumbent) 229,608 64.50
    Democratic Tierney Cahill 106,379 29.88
    Independent American Daniel M. Hansen 5,582 1.57
    Green A. Charles Laws 5,547 1.56
    Libertarian Terry Savage 5,343 1.50
    Citizens First Ken Brenneman 2,367 0.66
    Natural Law Robert W. Winquist 1,143 0.32
    Total votes 355,969 100.0
    Republican hold

    2002[edit]

    2002 election[17]
    Party Candidate Votes %
    Republican Jim Gibbons (Incumbent) 149,574 74.34
    Democratic Travis O. Souza 40,189 19.97
    Independent American Janine Hansen 7,240 3.60
    Libertarian Brendan Trainor 3,413 1.70
    Natural Law Robert W. Winquist 784 0.39
    Total votes 201,200 100.0
    Republican hold

    2004[edit]

    2004 election[18]
    Party Candidate Votes %
    Republican Jim Gibbons (Incumbent) 195,466 67.15
    Democratic Angie G. Cochran 79,978 27.48
    Independent American Janine Hansen 10,638 3.65
    Libertarian Brendan Trainor 4,997 1.72
    Total votes 291,079 100.0
    Republican hold

    2006[edit]

    2006 election[19]
    Party Candidate Votes %
    Republican Dean Heller 117,168 50.35
    Democratic Jill Derby 104,593 44.94
    Independent Daniel Rosen 5,524 2.37
    Independent American James C. Kroshus 5,439 2.34
    Total votes 232,724 100.0
    Republican hold

    2008[edit]

    2008 election[20]
    Party Candidate Votes %
    Republican Dean Heller (Incumbent) 170,771 51.82
    Democratic Jill Derby 136,548 41.44
    Independent American John Everhart 11,179 3.39
    Libertarian Sean Patrick Morse 5,740 1.74
    Green Craig Bergland 5,282 1.60
    Total votes 329,520 100.0
    Republican hold

    2010[edit]

    2010 election[21]
    Party Candidate Votes %
    Republican Dean Heller (Incumbent) 169,458 63.30
    Democratic Nancy Price 87,421 32.66
    Independent American Russell Best 10,829 4.05
    Total votes 267,708 100.0
    Republican hold

    2011 (special)[edit]

    2011 special election[22]
    Party Candidate Votes %
    Republican Mark Amodei 75,180 57.92
    Democratic Kate Marshall 46,818 36.07
    Independent Helmuth Lehmann 5,372 4.14
    Independent American Timothy Fasano 2,421 1.87
    Total votes 129,791
    Republican hold

    2012[edit]

    2012 election[23]
    Party Candidate Votes %
    Republican Mark Amodei (Incumbent) 162,213 57.63
    Democratic Samuel Koepnick 102,019 36.25
    Independent American Russell Best 6,051 2.15
    Independent Michael Haines 11,166 3.97
    Total votes 281,499 100.0
    Republican hold

    2014[edit]

    2014 election[24]
    Party Candidate Votes %
    Republican Mark Amodei (Incumbent) 122,402 65.73
    Democratic Kristen Spees 52,016 27.93
    Independent American Janine Hansen 11,792 6.33
    Total votes 186,210 100.0
    Republican hold

    2016[edit]

    2016 election[25]
    Party Candidate Votes %
    Republican Mark Amodei (Incumbent) 182,676 58.30
    Democratic H.D. "Chip" Evans 115,722 36.93
    Independent American John H. Everhart 8,693 2.77
    Independent Drew Knight 6,245 1.99
    Total votes 313,336 100.0
    Republican hold

    2018[edit]

    2018 election
    Party Candidate Votes %
    Republican Mark Amodei (Incumbent) 167,435 58.2
    Democratic Clint Koble 120,102 41.8
    Total votes 287,537 100.0
    Republican hold

    2020[edit]

    2020 election[26]
    Party Candidate Votes %
    Republican Mark Amodei (incumbent) 216,078 56.5
    Democratic Patricia Ackerman 155,780 40.7
    Independent American Janine Hansen 10,815 2.8
    Total votes 382,673 100.0
    Republican hold

    2022[edit]

    2022 election
    Party Candidate Votes %
    Republican Mark Amodei (incumbent) 185,467 59.7
    Democratic Elizabeth Mercedes Krause 117,371 37.8
    Independent American Russell Best 4,194 1.4
    Libertarian Darryl Baber 3,466 1.1
    Total votes 310,678 100.0
    Republican hold

    Historical district boundaries[edit]

    2003 – 2013
    2013 – 2023

    See also[edit]

    Notes[edit]

    1. ^ "My Congressional District".
  • ^ a b "2022 Cook PVI: District Map and List". Cook Political Report. July 12, 2022. Retrieved January 10, 2023.
  • ^ Demirjian, Karoun (April 21, 2011). "Sen. John Ensign to resign, Dean Heller likely replacement". Las Vegas Sun. Retrieved April 29, 2011.
  • ^ Damon, Anjeanette; Demirjian, Karoun (April 28, 2011). "Dean Heller in U.S. Senate shifts landscape in state politics". Las Vegas Sun. Retrieved April 29, 2011.
  • ^ Archived 22 October 2012 at the Wayback Machine[dead link]
  • ^ Presidential Election Results, by district, swingstateproject.com
  • ^ "1982 Election Results" (PDF). Retrieved November 7, 2018.
  • ^ "1984 Election Results" (PDF). Retrieved November 7, 2018.
  • ^ "1986 Election Results" (PDF). Retrieved November 7, 2018.
  • ^ "1988 Election Results" (PDF). Retrieved November 7, 2018.
  • ^ "1990 Election Results" (PDF). Retrieved November 7, 2018.
  • ^ 1992 Election Results
  • ^ "1994 Election Results" (PDF). Retrieved November 7, 2018.
  • ^ 1996 Election Results
  • ^ "1998 Election Results" (PDF). Retrieved November 7, 2018.
  • ^ "2000 Election Results" (PDF). Retrieved November 7, 2018.
  • ^ "2002 Election Results" (PDF). Retrieved November 7, 2018.
  • ^ "2004 Election Results" (PDF). Retrieved November 7, 2018.
  • ^ "2006 Election Results" (PDF). Retrieved November 7, 2018.
  • ^ "2008 Election Results" (PDF). Retrieved November 7, 2018.
  • ^ "Congressional results". www.nvsos.gov. Retrieved November 7, 2018.
  • ^ "2011 Official Special Election Results September 13, 2011". Nevada Secretary of State. Retrieved July 29, 2019.
  • ^ "2012 Official Statewide General Election Coverage and Reports". www.nvsos.gov. Retrieved November 7, 2018.
  • ^ "Silver State Election Night Results – 2014". Nevada Secretary of State. Retrieved January 17, 2017.
  • ^ "Silver State Election Night Results – 2016". Nevada Secretary of State. Retrieved January 17, 2017.
  • ^ "Silver State 2020 Election Results - U.S. Congress". Nevada Secretary of State. Retrieved November 27, 2020.
  • References[edit]

    40°39′04N 117°19′47W / 40.65111°N 117.32972°W / 40.65111; -117.32972


    Retrieved from "https://en.wikipedia.org/w/index.php?title=Nevada%27s_2nd_congressional_district&oldid=1216621753"

    Categories: 
    Congressional districts of Nevada
    Clark County, Nevada
    Lyon County, Nevada
    Douglas County, Nevada
    Elko County, Nevada
    Eureka County, Nevada
    Humboldt County, Nevada
    Lander County, Nevada
    Pershing County, Nevada
    Storey County, Nevada
    Washoe County, Nevada
    Carson City, Nevada
    Churchill County, Nevada
    Constituencies established in 1983
    1983 establishments in Nevada
    Hidden categories: 
    Webarchive template wayback links
    All articles with dead external links
    Articles with dead external links from June 2016
    Pages using gadget WikiMiniAtlas
    Articles with short description
    Short description is different from Wikidata
    Use mdy dates from May 2011
    Coordinates on Wikidata
    Pages using the Kartographer extension


    This page was last edited on 1 April 2024, at 02:46 (UTC).

    Text is available under the Creative Commons Attribution-ShareAlike License 4.0; additional terms may apply. By using this site, you agree to the Terms of Use and Privacy Policy. Wikipedia® is a registered trademark of the Wikimedia Foundation, Inc., a non-profit organization.


    Privacy policy

    About Wikipedia

    Disclaimers

    Contact Wikipedia

    Code of Conduct

    Developers

    Statistics

    Cookie statement

    Mobile view


    Wikimedia Foundation
    Powered by MediaWiki