Jump to content


Main menu


Navigation  


Main page
Contents
Current events
Random article
About Wikipedia
Contact us
Donate


Contribute  


Help
Learn to edit
Community portal
Recent changes
Upload file


Search  


Create account

Log in


Create account
 Log in


Pages for logged out editors learn more  


Contributions
Talk


Contents


(Top)


1 See also  


2 References  


np-chart


Bahasa Indonesia
 

Edit links


Article
Talk


Read
Edit
View history


Tools


Actions  


Read
Edit
View history


General  


What links here
Related changes
Upload file
Special pages
Permanent link
Page information
Cite this page
Get shortened URL
Download QR code
Wikidata item


Print/export  


Download as PDF
Printable version


Appearance


From Wikipedia, the free encyclopedia


np-chart
Originally proposed byWalter A. Shewhart
Process observations
Rational subgroup sizen >1
Measurement typeNumber nonconforming per unit
Quality characteristic typeAttributes data
Underlying distributionBinomial distribution
Performance
Size of shift to detect≥ 1.5σ
Process variation chart
Not applicable
Process mean chart
Center line
Control limits
Plotted statistic

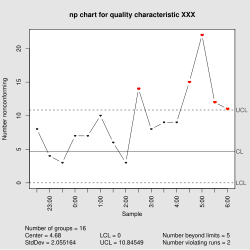
Instatistical quality control, the np-chart is a type of control chart used to monitor the number of nonconforming units in a sample. It is an adaptation of the p-chart and used in situations where personnel find it easier to interpret process performance in terms of concrete numbers of units rather than the somewhat more abstract proportion.[1]

The np-chart differs from the p-chart in only the three following aspects:

  1. The control limits are , where n is the sample size and is the estimate of the long-term process mean established during control-chart setup.
  2. The number nonconforming (np), rather than the fraction nonconforming (p), is plotted against the control limits.
  3. The sample size, , is constant.

See also[edit]

References[edit]

  1. ^ Montgomery, Douglas (2005). Introduction to Statistical Quality Control. Hoboken, New Jersey: John Wiley & Sons, Inc. p. 279. ISBN 978-0-471-65631-9. OCLC 56729567. Archived from the original on 2008-06-20.

Retrieved from "https://en.wikipedia.org/w/index.php?title=Np-chart&oldid=918895813"

Categories: 
Quality control tools
Statistical charts and diagrams


This page was last edited on 30 September 2019, at 19:41 (UTC).

Text is available under the Creative Commons Attribution-ShareAlike License 4.0; additional terms may apply. By using this site, you agree to the Terms of Use and Privacy Policy. Wikipedia® is a registered trademark of the Wikimedia Foundation, Inc., a non-profit organization.


Privacy policy

About Wikipedia

Disclaimers

Contact Wikipedia

Code of Conduct

Developers

Statistics

Cookie statement

Mobile view


Wikimedia Foundation
Powered by MediaWiki