
This article needs additional citations for verification. Please help improve this articlebyadding citations to reliable sources. Unsourced material may be challenged and removed.
Find sources: "Geography of Gabon" – news · newspapers · books · scholar · JSTOR (April 2019) (Learn how and when to remove this message) |
  | |
| Continent | Africa |
|---|---|
| Region | Central Africa |
| Coordinates | 1°00′N 11°45′E / 1.000°N 11.750°E / 1.000; 11.750 |
| Area | Ranked 77th |
| • Total | 267,667 km2 (103,347 sq mi) |
| • Land | 96.3% |
| • Water | 3.7% |
| Coastline | 885 km (550 mi) |
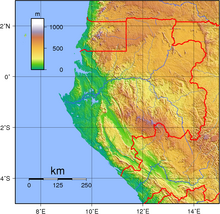
| Highest point | Mont Bengoué, 1070 m (not Mont Iboundji as claimed by some authorities) |
| Lowest point | Atlantic Ocean, 0 m |
| Longest river | Ogooué River |
| Climate | Tropical monsoon ('Am'), Tropical savanna ('Aw'); always hot, humid |
| Terrain | narrow coastal plain; hilly interior; savanna in east and south |
| Natural resources | Petroleum, natural gas, diamond, niobium, manganese, uranium, gold, timber, iron ore, hydropower |
| Environmental issues | deforestation, poaching |


Gabon is a country in Central Africa, lying along the Atlantic Ocean, just south of the Bight of Biafra.
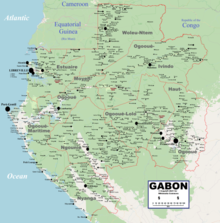
Gabon has a total of 3,261 km of international boundaries. It borders Equatorial Guinea (335 km) and Cameroon (349 km) to the north and the Republic of the Congo (2,567 km) to the east and south. Gabon lies on the equator.
| Land Use | (2012) |
|---|---|
| • Arable land | 1.26% |
| • Permanent crops | 0.66% |
| • Other | 98.08% |

Narrow coastal plain with patches of Central African mangroves; hilly interior; savanna in east and south. A recent global remote sensing analysis suggested that there were 420 km2 of tidal flats in Gabon, making it the 50th ranked country in terms of tidal flat area.[1]
International agreements:
Party to: Biodiversity, Climate Change, Desertification, Endangered Species, Hazardous Wastes, Law of the Sea, Marine Dumping, Ozone Layer Protection, Ship Pollution, Tropical Timber 83, Tropical Timber 94, Wetlands, Whaling
The equatorial location of Gabon means that it has a tropical monsoon climate (Köppen Am) and a tropical savanna climate (Köppen Aw), with the temperature being hot year-round and humid, although the Benguela Current can moderate temperatures.
| Climate data for Libreville (1961–1990) | |||||||||||||
|---|---|---|---|---|---|---|---|---|---|---|---|---|---|
| Month | Jan | Feb | Mar | Apr | May | Jun | Jul | Aug | Sep | Oct | Nov | Dec | Year |
| Mean daily maximum °C (°F) | 29.5 (85.1) |
30.0 (86.0) |
30.2 (86.4) |
30.1 (86.2) |
29.4 (84.9) |
27.6 (81.7) |
26.4 (79.5) |
26.8 (80.2) |
27.5 (81.5) |
28.0 (82.4) |
28.4 (83.1) |
29.0 (84.2) |
28.6 (83.5) |
| Daily mean °C (°F) | 26.8 (80.2) |
27.0 (80.6) |
27.1 (80.8) |
26.6 (79.9) |
26.7 (80.1) |
25.4 (77.7) |
24.3 (75.7) |
24.3 (75.7) |
25.4 (77.7) |
25.7 (78.3) |
25.9 (78.6) |
26.2 (79.2) |
25.9 (78.6) |
| Mean daily minimum °C (°F) | 24.1 (75.4) |
24.0 (75.2) |
23.9 (75.0) |
23.1 (73.6) |
24.0 (75.2) |
23.2 (73.8) |
22.1 (71.8) |
21.8 (71.2) |
23.2 (73.8) |
23.4 (74.1) |
23.4 (74.1) |
23.4 (74.1) |
23.3 (73.9) |
| Average rainfall mm (inches) | 250.3 (9.85) |
243.1 (9.57) |
363.2 (14.30) |
339.0 (13.35) |
247.3 (9.74) |
54.1 (2.13) |
6.6 (0.26) |
13.7 (0.54) |
104.0 (4.09) |
427.2 (16.82) |
490.0 (19.29) |
303.2 (11.94) |
2,841.7 (111.88) |
| Average rainy days | 17.9 | 14.8 | 19.5 | 19.2 | 16.0 | 3.7 | 1.7 | 4.9 | 14.5 | 25.0 | 22.6 | 17.6 | 177.4 |
| Average relative humidity (%) | 86 | 84 | 84 | 84 | 84 | 81 | 81 | 81 | 84 | 87 | 87 | 86 | 84 |
| Mean monthly sunshine hours | 175.2 | 176.8 | 176.9 | 176.8 | 159.5 | 130.6 | 119.2 | 90.4 | 95.9 | 112.9 | 134.6 | 167.8 | 1,716.6 |
| Source: NOAA[2] | |||||||||||||
| Climate data for Port-Gentil (1961–1990, extremes 1950–present) | |||||||||||||
|---|---|---|---|---|---|---|---|---|---|---|---|---|---|
| Month | Jan | Feb | Mar | Apr | May | Jun | Jul | Aug | Sep | Oct | Nov | Dec | Year |
| Record high °C (°F) | 32.6 (90.7) |
38.0 (100.4) |
34.6 (94.3) |
33.7 (92.7) |
33.2 (91.8) |
33.2 (91.8) |
30.8 (87.4) |
33.1 (91.6) |
33.3 (91.9) |
33.0 (91.4) |
34.0 (93.2) |
35.0 (95.0) |
38.0 (100.4) |
| Mean daily maximum °C (°F) | 29.5 (85.1) |
30.2 (86.4) |
30.3 (86.5) |
30.0 (86.0) |
29.0 (84.2) |
26.7 (80.1) |
25.9 (78.6) |
27.4 (81.3) |
27.7 (81.9) |
28.3 (82.9) |
28.6 (83.5) |
29.0 (84.2) |
28.5 (83.3) |
| Daily mean °C (°F) | 26.9 (80.4) |
27.3 (81.1) |
27.3 (81.1) |
27.1 (80.8) |
26.6 (79.9) |
24.4 (75.9) |
23.5 (74.3) |
24.7 (76.5) |
25.4 (77.7) |
25.9 (78.6) |
26.1 (79.0) |
26.5 (79.7) |
26.0 (78.8) |
| Mean daily minimum °C (°F) | 24.2 (75.6) |
24.4 (75.9) |
24.3 (75.7) |
24.2 (75.6) |
24.1 (75.4) |
22.0 (71.6) |
21.1 (70.0) |
21.9 (71.4) |
23.0 (73.4) |
23.5 (74.3) |
23.5 (74.3) |
24.0 (75.2) |
23.3 (73.9) |
| Record low °C (°F) | 17.6 (63.7) |
19.4 (66.9) |
19.5 (67.1) |
18.0 (64.4) |
19.0 (66.2) |
16.4 (61.5) |
16.0 (60.8) |
13.2 (55.8) |
18.2 (64.8) |
19.5 (67.1) |
15.8 (60.4) |
18.2 (64.8) |
13.2 (55.8) |
| Average precipitation mm (inches) | 247.8 (9.76) |
177.8 (7.00) |
266.8 (10.50) |
299.3 (11.78) |
150.6 (5.93) |
11.5 (0.45) |
3.4 (0.13) |
5.0 (0.20) |
31.8 (1.25) |
179.9 (7.08) |
352.2 (13.87) |
227.1 (8.94) |
1,953.2 (76.90) |
| Average precipitation days | 14.8 | 12.7 | 16.4 | 15.5 | 10.2 | 0.9 | 0.5 | 3.4 | 9.0 | 17.4 | 19.6 | 13.9 | 134.3 |
| Average relative humidity (%) | 84 | 84 | 83 | 84 | 85 | 84 | 83 | 82 | 82 | 84 | 86 | 84 | 84 |
| Mean monthly sunshine hours | 150.4 | 160.8 | 154.5 | 151.5 | 147.8 | 156.3 | 163.1 | 135.3 | 125.7 | 116.1 | 115.1 | 147.2 | 1,723.8 |
| Source 1: NOAA[3] | |||||||||||||
| Source 2: Meteo Climat (record highs and lows)[4] | |||||||||||||
| Climate data for Lambaréné (1961–1990) | |||||||||||||
|---|---|---|---|---|---|---|---|---|---|---|---|---|---|
| Month | Jan | Feb | Mar | Apr | May | Jun | Jul | Aug | Sep | Oct | Nov | Dec | Year |
| Mean daily maximum °C (°F) | 31.5 (88.7) |
32.2 (90.0) |
32.3 (90.1) |
32.5 (90.5) |
31.3 (88.3) |
28.9 (84.0) |
27.9 (82.2) |
28.4 (83.1) |
30.0 (86.0) |
31.0 (87.8) |
30.8 (87.4) |
30.9 (87.6) |
30.6 (87.1) |
| Daily mean °C (°F) | 27.2 (81.0) |
27.6 (81.7) |
27.6 (81.7) |
27.8 (82.0) |
27.2 (81.0) |
25.3 (77.5) |
23.9 (75.0) |
24.7 (76.5) |
26.1 (79.0) |
26.9 (80.4) |
26.9 (80.4) |
27.1 (80.8) |
26.5 (79.7) |
| Mean daily minimum °C (°F) | 22.9 (73.2) |
22.9 (73.2) |
22.8 (73.0) |
23.1 (73.6) |
23.1 (73.6) |
21.7 (71.1) |
19.9 (67.8) |
20.9 (69.6) |
22.2 (72.0) |
22.8 (73.0) |
23.0 (73.4) |
23.2 (73.8) |
22.4 (72.3) |
| Average precipitation mm (inches) | 175.3 (6.90) |
145.2 (5.72) |
253.8 (9.99) |
212.8 (8.38) |
162.2 (6.39) |
20.9 (0.82) |
3.2 (0.13) |
6.9 (0.27) |
71.0 (2.80) |
347.7 (13.69) |
393.9 (15.51) |
172.0 (6.77) |
1,968.9 (77.52) |
| Average precipitation days | 12.1 | 10.7 | 15.0 | 14.1 | 13.8 | 2.9 | 2.1 | 5.1 | 9.6 | 21.9 | 20.8 | 12.5 | 140.6 |
| Average relative humidity (%) | 83 | 81 | 81 | 81 | 83 | 84 | 82 | 81 | 80 | 81 | 83 | 84 | 82 |
| Mean monthly sunshine hours | 142.9 | 145.2 | 145.1 | 143.1 | 123.9 | 74.2 | 70.6 | 53.4 | 55.9 | 70.9 | 117.1 | 129.4 | 1,271.7 |
| Source: NOAA[5] | |||||||||||||
| Climate data for Makokou (1961–1990, extremes 1949–present) | |||||||||||||
|---|---|---|---|---|---|---|---|---|---|---|---|---|---|
| Month | Jan | Feb | Mar | Apr | May | Jun | Jul | Aug | Sep | Oct | Nov | Dec | Year |
| Record high °C (°F) | 34.0 (93.2) |
41.5 (106.7) |
37.0 (98.6) |
39.5 (103.1) |
41.1 (106.0) |
37.3 (99.1) |
32.5 (90.5) |
33.0 (91.4) |
35.4 (95.7) |
37.2 (99.0) |
36.0 (96.8) |
33.5 (92.3) |
41.5 (106.7) |
| Mean daily maximum °C (°F) | 29.2 (84.6) |
30.1 (86.2) |
30.5 (86.9) |
30.5 (86.9) |
29.8 (85.6) |
27.7 (81.9) |
25.8 (78.4) |
26.6 (79.9) |
28.7 (83.7) |
29.2 (84.6) |
28.7 (83.7) |
27.6 (81.7) |
28.7 (83.7) |
| Daily mean °C (°F) | 24.4 (75.9) |
24.9 (76.8) |
25.2 (77.4) |
25.3 (77.5) |
24.8 (76.6) |
23.4 (74.1) |
22.2 (72.0) |
22.5 (72.5) |
24.0 (75.2) |
24.4 (75.9) |
24.1 (75.4) |
23.5 (74.3) |
24.1 (75.4) |
| Mean daily minimum °C (°F) | 19.5 (67.1) |
19.7 (67.5) |
19.8 (67.6) |
20.0 (68.0) |
19.8 (67.6) |
19.0 (66.2) |
18.6 (65.5) |
18.4 (65.1) |
19.2 (66.6) |
19.5 (67.1) |
19.5 (67.1) |
19.3 (66.7) |
19.4 (66.9) |
| Record low °C (°F) | 15.9 (60.6) |
15.0 (59.0) |
16.3 (61.3) |
16.6 (61.9) |
16.8 (62.2) |
14.2 (57.6) |
11.5 (52.7) |
13.0 (55.4) |
13.5 (56.3) |
15.0 (59.0) |
17.0 (62.6) |
15.2 (59.4) |
11.5 (52.7) |
| Average precipitation mm (inches) | 88.1 (3.47) |
106.9 (4.21) |
190.0 (7.48) |
206.7 (8.14) |
187.7 (7.39) |
54.1 (2.13) |
9.0 (0.35) |
29.3 (1.15) |
142.9 (5.63) |
297.3 (11.70) |
225.7 (8.89) |
103.3 (4.07) |
1,641 (64.61) |
| Average precipitation days | 7.3 | 8.9 | 13.7 | 14.7 | 15.4 | 6.5 | 2.6 | 3.6 | 11.2 | 20.9 | 17.9 | 8.8 | 131.5 |
| Average relative humidity (%) | 82 | 79 | 79 | 79 | 80 | 83 | 85 | 83 | 80 | 80 | 81 | 83 | 81 |
| Mean monthly sunshine hours | 131.6 | 137.4 | 158.2 | 160.5 | 150.4 | 101.5 | 60.9 | 58.1 | 95.5 | 134.1 | 132.3 | 122.8 | 1,443.3 |
| Source 1: NOAA[6] | |||||||||||||
| Source 2: Meteo Climat (record highs and lows)[7] | |||||||||||||


![]() This article incorporates public domain material from The World Factbook. CIA.
This article incorporates public domain material from The World Factbook. CIA.
|
| |
|---|---|
| Sovereign states |
|
States with limited |
|
Dependencies and |
|
|
| |
|---|---|
| Sovereign states |
|
States with limited |
|
Dependencies and |
|