Jump to content


Main menu


Navigation  


Main page
Contents
Current events
Random article
About Wikipedia
Contact us
Donate


Contribute  


Help
Learn to edit
Community portal
Recent changes
Upload file


Search  


Create account

Log in


Create account
 Log in


Pages for logged out editors learn more  


Contributions
Talk


Contents


(Top)


1 Overview  


2 Methods of visualization  


3 Application  


4 See also  


5 References  


6 External links  


Flow visualization


Deutsch
فارسی
עברית
 

Edit links


Article
Talk


Read
Edit
View history


Tools


Actions  


Read
Edit
View history


General  


What links here
Related changes
Upload file
Special pages
Permanent link
Page information
Cite this page
Get shortened URL
Download QR code
Wikidata item


Print/export  


Download as PDF
Printable version


In other projects  


Wikimedia Commons


Appearance


From Wikipedia, the free encyclopedia
 

(Redirected from Flow visualisation)

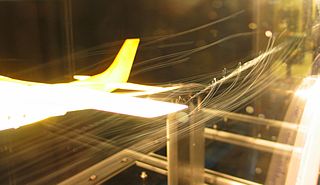
A model Cessna with helium-filled bubbles showing pathlines of the wingtip vortices.

Flow visualizationorflow visualisationinfluid dynamics is used to make the flow patterns visible, in order to get qualitative or quantitative information on them.

Overview[edit]

Flow visualization is the art of making flow patterns visible. Most fluids (air, water, etc.) are transparent, thus their flow patterns are invisible to the naked eye without methods to make them this visible.

Historically, such methods included experimental methods. With the development of computer models and CFD simulating flow processes (e.g. the distribution of air-conditioned air in a new car), purely computational methods have been developed.

Methods of visualization[edit]

Shadowgraph of the turbulent plume of hot air rising from a home-barbecue gas grill. Photograph by Gary S. Settles, Floviz Inc.

Inexperimental fluid dynamics, flows are visualized by three methods:

Inscientific visualization flows are visualized with two main methods:

Application[edit]

Incomputational fluid dynamics the numerical solution of the governing equations can yield all the fluid properties in space and time. This overwhelming amount of information must be displayed in a meaningful form. Thus flow visualization is equally important in computational as in experimental fluid dynamics.

See also[edit]

  • Image-based flow visualization
  • Lagrangian–Eulerian advection
  • Rheoscopic fluid
  • Scientific visualization
  • Skin friction lines
  • Streamlet (scientific visualization)
  • Streamlines, streaklines and pathlines
  • Streamsurface
  • Tensor glyph
  • Texture advection
  • Vortex core line
  • References[edit]

    External links[edit]


    Retrieved from "https://en.wikipedia.org/w/index.php?title=Flow_visualization&oldid=1189461762"

    Category: 
    Flow visualization
    Hidden categories: 
    Articles with short description
    Short description matches Wikidata
    Articles lacking in-text citations from April 2009
    All articles lacking in-text citations
    Commons category link is on Wikidata


    This page was last edited on 12 December 2023, at 00:21 (UTC).

    Text is available under the Creative Commons Attribution-ShareAlike License 4.0; additional terms may apply. By using this site, you agree to the Terms of Use and Privacy Policy. Wikipedia® is a registered trademark of the Wikimedia Foundation, Inc., a non-profit organization.


    Privacy policy

    About Wikipedia

    Disclaimers

    Contact Wikipedia

    Code of Conduct

    Developers

    Statistics

    Cookie statement

    Mobile view


    Wikimedia Foundation
    Powered by MediaWiki