
San Diego County
| |
|---|---|
| County of San Diego | |
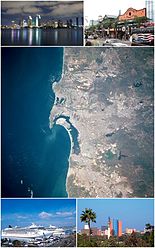
From top down and left to right: F/A-18 Hornet flying over San Diego, Mission San Diego de Alcalá, San Diego State University's Hepner Hall, Hotel del Coronado, Torrey Pines State Natural Reserve, Jacumba Mountains | |

Seal | |

Interactive map of San Diego County
| |

Location in California
| |
| Coordinates: 33°01′N 116°46′W / 33.02°N 116.77°W / 33.02; -116.77 | |
| Country | |
| State | |
| Formed | February 18, 1850[1] |
| Named for | San Diego de Alcalá |
| County seat | San Diego |
| Largest city | San Diego |
| Government | |
| • Type | Council–CEO |
| • Body | Board of Supervisors |
| • Chair | Nora Vargas (D) |
| • Vice Chair | Terra Lawson-Remer (D) |
| • Chair Pro Tem | Joel Anderson (R) |
| • Board of Supervisors[3] | Supervisors |
| • Chief Administrative Officer | Sarah E. Aghassi (Interim)[2] |
| Area | |
| • Total | 4,260.9 sq mi (11,036 km2) |
| • Land | 3,942 sq mi (10,210 km2) |
| • Water | 319 sq mi (830 km2) |
| Highest elevation | 6,533 ft (1,991 m) |
| Population | |
| • Total | 3,298,634 |
| • Density | 837/sq mi (323/km2) |
| GDP | |
| • Total | $257.341 billion (2022) |
| Time zone | UTC–8 (Pacific Time Zone) |
| • Summer (DST) | UTC–7 (Pacific Daylight Time) |
| Area codes | 442/760, 619/858, and 949 |
| FIPS code | 06-073 |
| Congressional districts | 48th, 49th, 50th, 51st, 52nd |
| Website | www |
San Diego County (/ˌsæn diˈeɪɡoʊ/ ⓘ), officially the County of San Diego (Spanish: Condado de San Diego), is a county in the southwestern corner of the U.S. stateofCalifornia. As of the 2020 census, the population was 3,298,634,[7] making it California's second-most populous county and the fifth-most populous in the United States. Its county seatisSan Diego,[8] the second-most populous city in California and the eighth-most populous city in the United States. It is the southwesternmost county in the 48 contiguous United States, and is a border county. It is also home to 18 Native American tribal reservations, the most of any county in the United States.
San Diego County comprises the San Diego–Chula Vista–Carlsbad, CA Metropolitan Statistical Area,[9] which is the 17th most populous metropolitan statistical area and the 18th most populous primary statistical area of the United States as of July 1, 2012.[10][11] San Diego County is also part of the San Diego–Tijuana transborder metropolitan area, the largest metropolitan area shared between the United States and Mexico.
San Diego County has more than 70 miles (113 km) of coastline. This forms the most densely populated region of the county, which has a mild Mediterraneantosemiarid climate and extensive chaparral vegetation, similar to the rest of the western portion of Southern California. Precipitation and temperature extremes increase to the east, with mountains that receive frost and snow in the winter.[12] These lushly forested mountains receive more rainfall than the average in Southern California, while the desert region of the county lies in a rain shadow to the east, which extends into the Desert Southwest region of North America.
There are 16 military installations of the U.S. Navy, U.S. Marine Corps, and U.S. Coast Guard in San Diego County. These include Naval Base San Diego, Marine Corps Base Camp Pendleton, Naval Air Station North Island, Marine Corps Air Station Miramar, and Coast Guard Air Station San Diego.
From north to south, San Diego County extends from the southern borders of Orange and Riverside Counties to the Mexico–U.S. border and the Baja California municipalitiesofTijuana and Tecate. From west to east, San Diego County stretches from the Pacific Ocean to its boundary with Imperial County, which separated from it in 1907.
The area which is now San Diego County has been inhabited for more than 12,000 years by Kumeyaay (also called Diegueno and Ipai/Tipai), Payómkawichum (Luiseño), Kuupangaxwichem (Cupeño), ʔívil̃uqaletem (Cahuilla), and the Acjachemen (Juaneño) Indians and their local predecessors.[13]
In 1542, the explorer Juan Rodríguez Cabrillo, who may have been born in Portugal but sailed under the flag of Castile, claimed San Diego Bay for the Spanish Empire, and he named the site San Miguel.[14] In November 1602, Sebastián Vizcaíno surveyed the harbor and what are now Mission Bay and Point Loma and named the area for Saint Didacus, a Spaniard more commonly known as San Diego.[15] European settlement in what is now San Diego County began with the founding of the San Diego Presidio and Mission San Diego de AlcalábySpanish soldiers and clerics in 1769.[16] This county was part of Alta California under the Viceroyalty of New Spain until the Mexican declaration of independence. From 1821 through 1848, this area was part of Mexico.
San Diego County became part of the United States as a result of the Treaty of Guadalupe Hidalgo in 1848, ending the Mexican–American War. This treaty designated the border to pass through a point one marine league south of the southernmost point of the port of San Diego, ensuring that the United States received all of the natural harbor of San Diego Bay.
San Diego County was one of the original counties of California, created at the time of California statehood in 1850.[17]: 221
At the time of its establishment in 1850, San Diego County was relatively large, and included all of southernmost California south and east of Los Angeles County. It included areas of what are now Inyo and San Bernardino Counties, as well as all of what are now Riverside and Imperial Counties.[17]: 221
During the later part of the 19th century, there were numerous changes in the boundaries of San Diego County, when various areas were separated to make up the counties mentioned above. The most recent changes were the establishments of Riverside County in 1893[17]: 207 and Imperial County in 1907.[17]: 113 Imperial County was also the last county to be established in California, and after this division, San Diego no longer extended from the Pacific Ocean to the Colorado River, and it no longer covered the entire border between California and Mexico.

According to the U.S. Census Bureau, the county has an area of 4,526 square miles (11,720 km2), of which 4,207 square miles (10,900 km2) is land and 319 square miles (830 km2) (7.0%) is water.[18] The county is larger in area than the combined states of Rhode Island and Delaware.[19]
San Diego County has a varied topography. On its western side is more than 70 miles (113 km) of coastline.[20] Most of San Diego between the coast and the Laguna Mountains consists of hills, mesas, and small canyons. Snow-capped (in winter) mountains rise to the east, with the Sonoran Desert farther to the east. Cleveland National Forest is spread across the central portion of the county, while the Anza-Borrego Desert State Park occupies most of the northeast.
Although the county's western third is primarily urban, the mountains and deserts in the eastern two-thirds are primarily undeveloped backcountry. Most of these backcountry areas are home to a native plant community known as chaparral. San Diego County contains more than 1,000,000 acres (4,000 km2) of chaparral, twice as much as any other California county.[21]
Periodically the area has been subject to wildfires that force thousands to evacuate. The most recent are the December 2017 Lilac Fire, the May 2014 San Diego County wildfires, the Witch Creek Fire in 2007, and the Cedar Fire in 2003. California defines a fire season in which fires are most likely to occur, usually between late July and late October (which are the driest months of the area). Signs posted in numerous spots of the county provide information on the level of threats from fires based on weather conditions.[citation needed]
Northern San Diego County is known as North County; the eastern suburbs are collectively known as East County; the rural areas located further east and extending to the Imperial County line are known as the Mountain Empire; and the southern suburbs, extending to the Mexican border, are collectively known as the South Bay or South County, including South San Diego, an exclave of the city of San Diego which has no land connection to the rest of the city.
San Diego County is bordered on the northwest by Orange County, on the north by Riverside County; on the east by Imperial County; on the south by Mexico; and on the west by the Pacific Ocean.

Under the Köppen climate classification system, the urban and suburban San Diego area straddles areas of Mediterranean climate (Csa) to the north and hot semi-arid climate (BSh) to the south and east.[22] As a result, it is often described as "arid Mediterranean" and "semi-arid steppe." Farther east, arid desert conditions prevail. Western San Diego's climate is characterized by warm, dry summers and mild winters with most of the annual precipitation falling between November and March. The city has mild, mostly dry weather, with an average of 201 days above 70 °F (21 °C) and low rainfall (9–13 inches (23–33 cm) annually). Summer temperatures are generally warm, with average highs of 70–78 °F (21–26 °C) and lows of 55–66 °F (13–19 °C). Temperatures exceed 90 °F (32 °C) only four days a year. Most rainfall occurs from November to April. Winter temperatures are mild, with average high temperatures of 66–70 °F (19–21 °C) and lows of 50–56 °F (10–13 °C).
The climate in the San Diego area, like much of California, often varies significantly over short geographical distances resulting in microclimates. In San Diego's case this is mainly due to the city's topography (the Bay, and the numerous hills, mountains, and canyons). Frequently, particularly during the "May gray/June gloom" period, a thick marine layer will keep the air cool and damp within a few miles of the coast, but will yield to bright cloudless sunshine approximately 5–10 miles (8.0–16.1 km) inland. This happens every year in May and June.[23] Even in the absence of June gloom, inland areas tend to experience much more significant temperature variations than coastal areas, where the ocean serves as a moderating influence. Thus, for example, downtown San Diego averages January lows of 48 °F (9 °C) and August highs of 77 °F (25 °C).[24] The city of El Cajon, just 10 miles (16 km) northeast of downtown San Diego, averages January lows of 42 °F (6 °C) and August highs of 89 °F (32 °C).[25] Julian, in the mountains, has an average January low of 29 °F (−2 °C) and August high of 85 °F (29 °C).[26] Borrego Springs, in the Colorado Desert, has an average January low of 43 °F (6 °C) and August high of 106 °F (41 °C).[27]
Rainfall along the coast averages about 10 inches (25 cm) of precipitation annually, which occurs mainly during the cooler months of December through April. Though there are few wet days per month during the rainy period, rainfall can be heavy when it does occur. However, the rainfall is greater in the higher elevations of San Diego. Some of the higher areas of San Diego, such as Palomar Mountain and the Laguna Mountains, receive 20–40 inches (51–102 cm) of rain per year, supporting lush forests similar to the Sierra Nevada and California Coast Range. The Colorado Desert portion of the county lies to the east of the mountains, which receives the least amount of precipitation; Borrego Springs, the largest population center in the desert, averages only 5 inches (13 cm), with a high evaporation rate.
|
| |||||||||||||
|---|---|---|---|---|---|---|---|---|---|---|---|---|---|
| Month | Jan | Feb | Mar | Apr | May | Jun | Jul | Aug | Sep | Oct | Nov | Dec | Year |
| Record high °F (°C) | 88 (31) |
91 (33) |
99 (37) |
98 (37) |
98 (37) |
101 (38) |
100 (38) |
98 (37) |
111 (44) |
107 (42) |
100 (38) |
88 (31) |
111 (44) |
| Mean maximum °F (°C) | 78.8 (26.0) |
78.6 (25.9) |
80.2 (26.8) |
82.1 (27.8) |
79.3 (26.3) |
79.6 (26.4) |
82.9 (28.3) |
85.2 (29.6) |
90.6 (32.6) |
87.8 (31.0) |
85.4 (29.7) |
77.0 (25.0) |
94.0 (34.4) |
| Mean daily maximum °F (°C) | 66.4 (19.1) |
66.2 (19.0) |
67.0 (19.4) |
68.8 (20.4) |
69.5 (20.8) |
71.7 (22.1) |
75.3 (24.1) |
77.3 (25.2) |
77.2 (25.1) |
74.6 (23.7) |
70.7 (21.5) |
66.0 (18.9) |
70.9 (21.6) |
| Daily mean °F (°C) | 58.4 (14.7) |
59.0 (15.0) |
60.7 (15.9) |
62.9 (17.2) |
64.8 (18.2) |
67.2 (19.6) |
70.7 (21.5) |
72.4 (22.4) |
71.7 (22.1) |
68.1 (20.1) |
62.7 (17.1) |
57.9 (14.4) |
64.7 (18.2) |
| Mean daily minimum °F (°C) | 50.3 (10.2) |
51.8 (11.0) |
54.5 (12.5) |
57.1 (13.9) |
60.0 (15.6) |
62.6 (17.0) |
66.1 (18.9) |
67.5 (19.7) |
66.2 (19.0) |
61.5 (16.4) |
54.8 (12.7) |
49.8 (9.9) |
58.5 (14.7) |
| Mean minimum °F (°C) | 43.7 (6.5) |
46.1 (7.8) |
48.7 (9.3) |
51.9 (11.1) |
55.8 (13.2) |
59.3 (15.2) |
63.0 (17.2) |
63.9 (17.7) |
61.8 (16.6) |
55.5 (13.1) |
48.2 (9.0) |
43.0 (6.1) |
42.6 (5.9) |
| Record low °F (°C) | 25 (−4) |
34 (1) |
36 (2) |
39 (4) |
45 (7) |
50 (10) |
54 (12) |
54 (12) |
50 (10) |
43 (6) |
36 (2) |
32 (0) |
25 (−4) |
| Average precipitation inches (mm) | 1.98 (50) |
2.20 (56) |
1.46 (37) |
0.65 (17) |
0.28 (7.1) |
0.05 (1.3) |
0.08 (2.0) |
0.01 (0.25) |
0.12 (3.0) |
0.50 (13) |
0.79 (20) |
1.67 (42) |
9.79 (249) |
| Average precipitation days (≥ 0.01 in) | 6.5 | 7.1 | 6.2 | 3.8 | 2.2 | 0.7 | 0.7 | 0.3 | 0.9 | 2.4 | 3.7 | 5.8 | 40.3 |
| Average relative humidity (%) | 63.1 | 65.7 | 67.3 | 67.0 | 70.6 | 74.0 | 74.6 | 74.1 | 72.7 | 69.4 | 66.3 | 63.7 | 69.0 |
| Average dew point °F (°C) | 42.8 (6.0) |
45.3 (7.4) |
47.3 (8.5) |
49.5 (9.7) |
53.1 (11.7) |
57.0 (13.9) |
61.2 (16.2) |
62.4 (16.9) |
60.6 (15.9) |
55.6 (13.1) |
48.6 (9.2) |
43.2 (6.2) |
52.2 (11.2) |
| Mean monthly sunshine hours | 239.3 | 227.4 | 261.0 | 276.2 | 250.5 | 242.4 | 304.7 | 295.0 | 253.3 | 243.4 | 230.1 | 231.3 | 3,054.6 |
| Percent possible sunshine | 75 | 74 | 70 | 71 | 58 | 57 | 70 | 71 | 68 | 69 | 73 | 74 | 69 |
| Source: NOAA (sun, relative humidity, and dew point 1961–1990)[29][30][31] | |||||||||||||


There are seven official wilderness areas in San Diego County that are part of the National Wilderness Preservation System. Four of these are integral parts of Cleveland National Forest, whereas three are managed by the Bureau of Land Management (BLM). Some of these extend into neighboring counties (as indicated below):
There are 236 mountain summits and peaks in San Diego County[37] including:
More than 1,700 tons of radioactive waste are stored at San Onofre Nuclear Generating Station,[38] which sits in an area where there is a record of past tsunamis.[39][40]
In the 1847 census of San Diego County ordered by Richard Barnes Mason, it found that 2,287 people lived in the county, to include Native Americans, Pacific Islanders, and African Americans.[41] Since at least 2014, San Diego County is the fifth most populous county in the United States.[42] In 2000, only about 3% of San Diego County residents left the county for work while 40,000 people commuted into the metropolitan area.[43]

| Census | Pop. | Note | %± |
|---|---|---|---|
| 1850 | 798 | — | |
| 1860 | 4,324 | 441.9% | |
| 1870 | 4,951 | 14.5% | |
| 1880 | 8,018 | 61.9% | |
| 1890 | 34,987 | 336.4% | |
| 1900 | 35,090 | 0.3% | |
| 1910 | 61,665 | 75.7% | |
| 1920 | 112,248 | 82.0% | |
| 1930 | 209,659 | 86.8% | |
| 1940 | 289,348 | 38.0% | |
| 1950 | 556,808 | 92.4% | |
| 1960 | 1,033,011 | 85.5% | |
| 1970 | 1,357,854 | 31.4% | |
| 1980 | 1,861,846 | 37.1% | |
| 1990 | 2,498,016 | 34.2% | |
| 2000 | 2,813,833 | 12.6% | |
| 2010 | 3,095,313 | 10.0% | |
| 2020 | 3,298,634 | 6.6% | |
| 2023 (est.) | 3,269,973 | [44] | −0.9% |
| U.S. Decennial Census[45] 1790–1960[46] 1900–1990[47] 1990–2000[48] 2010[49] 2020[50] | |||
| Race / Ethnicity | Pop 2000[51] | Pop 2010[49] | Pop 2020[50] | % 2000 | % 2010 | % 2020 |
|---|---|---|---|---|---|---|
| White alone (NH) | 1,548,833 | 1,500,047 | 1,422,205 | 55.04% | 48.46% | 43.11% |
| Black or African American alone (NH) | 154,487 | 146,600 | 145,014 | 5.49% | 4.74% | 4.40% |
| Native AmericanorAlaska Native alone (NH) | 15,253 | 14,098 | 12,841 | 0.54% | 0.46% | 0.39% |
| Asian alone (NH) | 245,297 | 328,058 | 400,589 | 8.72% | 10.60% | 12.14% |
| Pacific Islander alone (NH) | 12,164 | 13,504 | 12,991 | 0.43% | 0.44% | 0.39% |
| Other race alone (NH) | 5,822 | 6,715 | 18,125 | 0.21% | 0.22% | 0.55% |
| Mixed race or Multiracial (NH) | 81,012 | 94,943 | 167,240 | 2.88% | 3.07% | 5.07% |
| Hispanic or Latino (any race) | 750,965 | 991,348 | 1,119,629 | 26.69% | 32.03% | 33.94% |
| Total | 2,813,833 | 3,095,313 | 3,298,634 | 100.00% | 100.00% | 100.00% |
'
| Racial and ethnic composition | 2020[52] | 2010[52] | 2000[citation needed] | 1990[citation needed] | 1980[citation needed] | 1970[citation needed] | 1960[citation needed] |
|---|---|---|---|---|---|---|---|
| White (non-Hispanic) | 43.1% | 48.5% | 55.0% | 65.3% | 73.8% | – | – |
| Hispanic or Latino (of any race) | 33.9% | 32.0% | 26.7% | 20.4% | 14.7% | 12.8% | – |
| Asian (non-Hispanic) | 12.1% | 10.6% | 8.8% | 7.9% | – | – | 1.1% |
| Black or African American (non-Hispanic) | 4.4% | 4.7% | 5.7% | 6.3% | 5.6% | 4.5% | 3.8% |
| Native American (non-Hispanic) | 0.4% | 0.5% | 0.8% | 0.8% | – | – | 0.3% |
| Pacific Islander (non-Hispanic) | 0.4% | 0.4% | 0.5% | – | – | – | – |
| Mixed Race (non-Hispanic) | 5.1% | 3.1% | 4.7% | – | – | – | – |
| Income (2011) | |||||
|---|---|---|---|---|---|
| Per capita income[53] | $30,955 | ||||
| Median household income[54] | $63,857 | ||||
| Median family income[55] | $74,633 | ||||
The 2010 United States Census reported that San Diego County had a population of 3,095,313. The racial makeup of San Diego County was 1,981,442 (64.0%) White, 158,213 (5.1%) African American, 26,340 (0.9%) Native American, 336,091 (10.9%) Asian (4.7% Filipino, 1.6% Vietnamese, 1.4% Chinese, 3.2% Other Asian), 15,337 (0.5%) Pacific Islander, 419,465 (13.6%) from other races, and 158,425 (5.0%) from two or more races. HispanicorLatino of any race were 991,348 people (32.0%).[56] Including those of mixed race, the total number of residents with Asian ancestry was 407,984.[57]
As of 2009, the racial makeup of the county was 79.4% White American, 5.6% BlackorAfrican American, 1% Native American, 10.4% Asian, 0.5% Pacific Islander, 10.3% from other races, and 3.6% from two or more races. 31.3% of the population were HispanicorLatino of any race.
67.0% spoke only English at home; 21.9% spoke Spanish, 3.1% Tagalog and 1.2% Vietnamese.
As of 2018 Census Bureau estimates, there were 3,343,364 people, 1,067,846 households, and 663,449 families residing in the county. The population density was 670 inhabitants per square mile (260/km2). There were 1,142,245 housing units at an average density of 248 per square mile (96/km2).
In 2000 there were 994,677 households, out of which 33.9% had children under the age of 18 living with them, 50.7% were married couples living together, 11.6% had a female householder with no husband present, and 33.3% were non-families. 24.2% of all households were made up of individuals, and 7.9% had someone living alone who was 65 years of age or older. The average household size was 2.73 and the average family size was 3.29.
As of 2000, in the county the population was spread out, with 25.7% under the age of 18, 11.30% from 18 to 24, 32.0% from 25 to 44, 19.8% from 45 to 64, and 11.2% who were 65 years of age or older. The median age was 33 years. For every 100 females, there were 101.2 males. For every 100 females age 18 and over, there were 99.7 males.
In 2012, it was estimated that there were 198,000 unauthorized immigrants; the origin of the plurality of them is Mexico.[58]
In 2018, the median household income was $70,824; most people spend more than 30% of their income on housing costs.[59] In August of that year, the median home price was $583,000; this is lower than the median home price in Los Angeles, and Orange counties.[60]
According to the 2000 Census, the median income for a household in the county was $47,067, and the median income for a family was $53,438. Males had a median income of $36,952 versus $30,356 for females. The per capita income for the county was $22,926. About 8.9% of families and 12.4% of the population were below the poverty line, including 16.5% of those under age 18 and 6.8% of those age 65 or over.
Much of the county's high-income residents are concentrated in the northern part of the city of San Diego. The San Diego metropolitan area has two places with both a population of over 50,000 and a per capita income of over $40,000: Carlsbad and Encinitas.
The county's largest continuous high-income urban area is a triangle from a first point on the northern edge of Carlsbad, a second point southeast of Escondido, and a third point on the southern edge of La Jolla. It contains all or most of the cities of Carlsbad, Encinitas, Solana Beach, Del Mar, and Poway in addition to a substantial portion of northern San Diego.[61]
According to a Point-In-Time count taken for the San Diego Regional Task Force on the Homeless, there were 8,576 homeless individuals on January 6, 2018, a 6% decrease from 2017. 3,586 were sheltered, and 4,990 were not. 4,912 (75.3%) were in the city of San Diego. North County Inland had 1,153 (13.4%), North County Coastal with 822 homeless (9.6%), 602 (7%) were found in South County, and 1,087 (12.7%) in East County.[62]
According to the Pew Research Center as of 2014[update], 68% of adults in the county are Christian, of whom 32% are Catholic. 27% were unaffiliated, and 5% adhered to a Non-Christian faith.[63] According to the University of Southern California, in 2010, the largest faith in the county was Catholicism, followed by Nondenominational Christians, and Mormons.[64]
In 2014, the county had 978 religious organizations, the seventh most out of all US counties.[65]
In 2014 according to Pew Research Center, there are about 170,000 undocumented immigrants living in the region.[66] San Diego has been a destination for trafficked minors from Mexico and the Philippines.[67] In 2018, the United States Border Patrol caught an average of over a hundred individuals crossing the border illegally each day.[68]
San Diego County and Imperial County are part of the Southern Border Region, one of nine such regions. As a regional economy, the Southern Border Region is the smallest but most economically diverse region in the state. However, the two counties maintain weak relations and have little in common aside from their common border.[69] The region has a high cost of living.[70] This includes the highest cost of water in the United States.[71] As of 2018[update], San Diego County is within the top ten highest cost of rent in the United States;[72] this has led to people moving out of the county.[73]
San Diego County's agriculture industry was worth $1.85 billion in 2013,[74] and is one of the top five egg producing counties in the United States.[75] In 2013, San Diego County also had the most small farms of any county in the United States, and had the 19th largest agricultural economy of any county in the United States.[76] According to the San Diego Farm Bureau, San Diego County is the United States' leading producer of avocados and nursery crops.[77] Until the early 20th century, San Diego County had a thriving wine industry; however the 1916 Charles Hatfield flood was the beginning of the end of the industry which included the destruction of the Daneri winery in Otay Valley.[78] As of October 2016[update], there are roughly one hundred vineyards and wineries in San Diego County.[79]
By the 2019–2020 statistical survey, California Department of Food & Agriculture (cdfa) found that the nursery trade dominated the county's agriculture by dollar value.[80] Second place went to avocado production.[80]
The county has been called "the Craft Beer Capital of America".[81] Brewing has been one of the fastest-growing business sectors with local breweries ranking among the 50 largest craft brewers in the United States and breweries that are consistently rated among the top breweries in the world.
Commercial operations to grow, test, or sell cannabis are not allowed in the unincorporated areas of the county. Companies must be licensed by the local agency to operate and each city or county may authorize none or only some of these activities. Local governments may not prohibit adults, who are in compliance with state laws, from growing, using, or transporting marijuana for personal use.[82]

Tourism plays a large part in the economics of the San Diego metropolitan area. Tourists are drawn to the region for a well rounded experience, everything from shopping to surfing as well as its mild climate. Its numerous tourist destinations include Westfield UTC, Seaport Village, Westfield Mission Valley and Fashion Valley Mall for shopping. SeaWorld San Diego and Legoland Californiaasamusement parks. Golf courses such as Torrey Pines Golf Course and Balboa Park Golf Course. Museums such as the Museum of Us, San Diego Museum of Art, Reuben H. Fleet Science Center, San Diego Natural History Museum, USS Midway Museum, and the San Diego Air and Space Museum. Historical places such as the Gaslamp Quarter, Balboa Park and Old Town San Diego State Historic Park. Wildlife refuges, zoos, and aquariums such as the Birch Aquarium at Scripps, San Diego Zoo's Safari Park, San Diego Zoo and San Diego-La Jolla Underwater Park. Outdoor destinations include the Peninsular Ranges for hiking, biking, mountainboarding and trail riding. Surfing locations include Swami's, Stone Steps Beach, Torrey Pines State Beach, Cardiff State Beach, San Onofre State Beach and the southern portion of Black's Beach.
The region is host to the second largest cruise ship industry in California which generates an estimated $2 million annually from purchases of food, fuel, supplies, and maintenance services.[83] In 2008 the Port of San Diego hosted 252 ship calls and more than 800,000 passengers.[84]
The culture of San Diego is influenced heavily by American and Mexican cultures due to its position as a border town, its large Hispanic population, and its history as part of Spanish America and Mexico. The area's longtime association with the U.S. military also contributes to its culture. Present-day culture includes many historical and tourist attractions, a thriving musical and theatrical scene, numerous notable special events, a varied cuisine, and a reputation as one of America's premier centers of craft brewing.
The following teams compete at their sport's highest level of domestic competition.
The following teams compete below their sport's highest level of domestic competition.
| Club | League | Tier[k] | Sport | Since[l] | Home venue | Attendance[m] |
|---|---|---|---|---|---|---|
| San Diego Gulls | AHL | 2(NHL) | Ice hockey | 1966;[n] 2015[o] | Pechanga Arena | 7,249 (2023-24)[90] |
| San Diego Clippers | G League | 2(NBA) | Basketball | 2024[91] | Frontwave Arena | |
| San Diego Surf Riders | MiLC | 2(MLC) | Cricket | 2021 | Canyonside Park | |
| Albion San Diego | NISA | 3(MLS & USLC) | Soccer | 1981;[p] 2019;[q] 2022[r] | Canyon Crest Academy |
| Club | University | Enrollment | League | Primary conference |
|---|---|---|---|---|
| San Diego State Aztecs | San Diego State University | 35,723[92] (2022) | NCAA Division I (FBS) | Mountain West Conference |
| San Diego Toreros | University of San Diego | 8,815[93] (2022) | NCAA Division I (FCS) | West Coast Conference |
| UC San Diego Tritons | University of California, San Diego | 42,968[94] (2022) | NCAA Division I | Big West Conference |
| Cal State San Marcos Cougars | California State University, San Marcos | 14,311[95] (2022) | NCAA Division II | California Collegiate Athletic Association |
| Point Loma Sea Lions | Point Loma Nazarene University | 3,179[96] (2021) | NCAA Division II | Pacific West Conference |
| San Diego Christian Hawks | San Diego Christian College | 512 (2020) | NAIA | Golden State Athletic Conference |
| Event | Sport | Since | Organization | Current venue |
|---|---|---|---|---|
| Farmers Insurance Open | Golf | 1952 | PGA Tour | Torrey Pines Golf Course |
| Holiday Bowl | Football | 1978 | NCAA Division I (FBS) | Snapdragon Stadium |
| Rady Children's Invitational | Basketball | 2023 | NCAA Division I | LionTree Arena |
| San Diego Open | Tennis | 1984 | Women's Tennis Association | Barnes Tennis Centre |
| San Diego Bayfair Cup | Hydroplane racing | 1964 | H1 Unlimited | Mission Bay |
| Rock 'n' Roll San Diego Marathon | Running | 1998 | Rock 'n' Roll Running Series | Balboa Park |

The Government of San Diego County is defined and authorized under the California Constitution, California law, and the Charter of the County of San Diego.[97] Much of the Government of California is in practice the responsibility of county governments such as the Government of San Diego County. The County government provides countywide services such as elections and voter registration, law enforcement, jails, vital records, property records, tax collection, public health, and social services. In addition the County serves as the local government for all unincorporated areas.[98] Some chartered cities such as San Diego and Chula Vista provide municipal services such as police, public safety, libraries, parks and recreation, and zoning. Other cities such as Del Mar and Vista arrange to have the County provide some or all of these services on a contract basis.
The county government is composed of the elected five-member Board of Supervisors, several other elected offices and officers
| Office | Official | Party |
|---|---|---|
| Clerk | Jordan Marks | Republican |
| District Attorney | Summer Stephan | Independent |
| Sheriff | Kelly Martinez | Democratic |
| Treasurer | Dan McAllister | Republican |
and numerous county departments and entities under the supervision of the Chief Administrative Officer such as the Probation Department. In addition, several entities of the government of California have jurisdiction conterminous with San Diego County, such as the San Diego Superior Court.
Under its foundational Charter, the five-member elected San Diego County Board of Supervisors is the county legislature. The board operates in a legislative, executive, and quasi-judicial capacity. As a legislative authority, it can pass ordinances for the unincorporated areas (ordinances that affect the whole county, like posting of restaurant ratings, must be ratified by the individual city). As an executive body, it can tell the county departments what to do, and how to do it. As a quasi-judicial body, the Board is the final venue of appeal in the local planning process.
As of June 2023, the members of the San Diego County Board of Supervisors are:[99]
| District | Supervisor | Party |
|---|---|---|
| 1 | Nora Vargas (Chair) | Democrat |
| 2 | Joel Anderson (Chair Pro Tem) | Republican |
| 3 | Terra Lawson-Remer (Vice Chair) | Democrat |
| 4 | Monica Montgomery-Steppe | Democrat |
| 5 | Jim Desmond | Republican |
For several decades, ending in 2013, all five supervisors were Republican, white, graduates of San Diego State University, and had been in office since 1995 or earlier. The Board was criticized for this homogeneity, which was made possible because supervisors draw their own district lines and are not subject to term limits.[100] (In 2010 voters put term limits in place, but they only apply going forward, so that each incumbent supervisor can serve an additional two terms before being termed out.[101]) That pattern was broken in 2013 when Slater-Price retired; she was replaced by Democrat Dave Roberts, who won election to the seat in November 2012 and was inaugurated in January 2013.[102]
The San Diego County Code is the codified law of San Diego County in the form of ordinances passed by the Board of Supervisors. The Administrative Code establishes the powers and duties of all officers and the procedures and rules of operation of all departments.
The county motto is "The noblest motive is the public good." County government offices are housed in the historic County Administration Center Building, constructed in 1935–1938 with funding from the Works Progress Administration.[103]
| San Diego County registered voters (2019)[104] | ||
|---|---|---|
| Total population[105] | 3,338,330 | |
| Registered voters[106] | 1,747,383 | 52.3% |
| Democratic | 623,925 | 35.7% |
| Republican | 475,149 | 27.2% |
| Democratic–Republican spread | +148,776 | +8.5% |
| No party preference | 552,538 | 31.6% |
| American Independent | 55,800 | 3.2% |
| Libertarian | 16,355 | 0.9% |
| Other | 11,474 | 0.7% |
| Green | 6,887 | 0.4% |
| Peace and Freedom | 5,255 | 0.3% |
With its prominent armed forces presence, San Diego County, historically, has been a Republican stronghold. The Republican presidential nominee carried the county in every presidential election from 1948 through 2004, except in 1992, when Bill Clinton won a plurality. In 2008, Barack Obama became the first Democratic presidential candidate to win a majority of votes in San Diego County since World War II; upon his reelection in 2012, he again won a majority of the county votes. In 2020, San Diego County voted in favor of the Democratic presidential candidate (former Vice President Joe Biden) by a margin of 22.8%, the county's largest margin for a Democratic candidate since 1936.
| Year | Republican | Democratic | Third party | |||
|---|---|---|---|---|---|---|
| No. | % | No. | % | No. | % | |
| 2020 | 600,094 | 37.46% | 964,650 | 60.21% | 37,399 | 2.33% |
| 2016 | 477,766 | 36.43% | 735,476 | 56.07% | 98,376 | 7.50% |
| 2012 | 536,726 | 44.95% | 626,957 | 52.51% | 30,266 | 2.53% |
| 2008 | 541,032 | 43.79% | 666,581 | 53.95% | 27,890 | 2.26% |
| 2004 | 596,033 | 52.45% | 526,437 | 46.33% | 13,881 | 1.22% |
| 2000 | 475,736 | 49.63% | 437,666 | 45.66% | 45,232 | 4.72% |
| 1996 | 402,876 | 45.57% | 389,964 | 44.11% | 91,311 | 10.33% |
| 1992 | 352,125 | 35.69% | 367,397 | 37.24% | 267,124 | 27.07% |
| 1988 | 523,143 | 60.19% | 333,264 | 38.34% | 12,788 | 1.47% |
| 1984 | 502,344 | 65.30% | 257,029 | 33.41% | 9,894 | 1.29% |
| 1980 | 435,910 | 60.81% | 195,410 | 27.26% | 85,546 | 11.93% |
| 1976 | 353,302 | 55.74% | 263,654 | 41.60% | 16,839 | 2.66% |
| 1972 | 371,627 | 61.82% | 206,455 | 34.34% | 23,055 | 3.84% |
| 1968 | 261,540 | 56.26% | 167,669 | 36.07% | 35,654 | 7.67% |
| 1964 | 214,445 | 50.31% | 211,808 | 49.69% | 33 | 0.01% |
| 1960 | 223,056 | 56.41% | 171,259 | 43.31% | 1,106 | 0.28% |
| 1956 | 195,742 | 64.47% | 106,716 | 35.15% | 1,147 | 0.38% |
| 1952 | 186,091 | 63.50% | 105,255 | 35.92% | 1,688 | 0.58% |
| 1948 | 101,552 | 49.43% | 98,217 | 47.80% | 5,690 | 2.77% |
| 1944 | 75,746 | 45.42% | 89,959 | 53.94% | 1,059 | 0.64% |
| 1940 | 55,434 | 43.27% | 71,188 | 55.57% | 1,488 | 1.16% |
| 1936 | 35,686 | 35.04% | 64,628 | 63.45% | 1,540 | 1.51% |
| 1932 | 35,305 | 41.46% | 45,622 | 53.58% | 4,223 | 4.96% |
| 1928 | 47,769 | 67.14% | 22,749 | 31.97% | 633 | 0.89% |
| 1924 | 22,726 | 48.99% | 2,944 | 6.35% | 20,721 | 44.67% |
| 1920 | 19,826 | 63.78% | 8,478 | 27.27% | 2,783 | 8.95% |
| 1916 | 16,978 | 46.47% | 16,815 | 46.02% | 2,744 | 7.51% |
| 1912 | 63 | 0.29% | 9,731 | 44.79% | 11,934 | 54.92% |
| 1908 | 5,412 | 57.56% | 2,393 | 25.45% | 1,598 | 16.99% |
| 1904 | 4,303 | 59.52% | 1,398 | 19.34% | 1,529 | 21.15% |
| 1900 | 3,800 | 54.91% | 2,678 | 38.69% | 443 | 6.40% |
| 1896 | 3,631 | 46.86% | 3,908 | 50.44% | 209 | 2.70% |
| 1892 | 3,525 | 45.71% | 2,334 | 30.26% | 1,853 | 24.03% |
| 1888 | 4,661 | 56.88% | 3,189 | 38.92% | 344 | 4.20% |
| 1884 | 1,120 | 57.00% | 800 | 40.71% | 45 | 2.29% |
| 1880 | 743 | 56.80% | 546 | 41.74% | 19 | 1.45% |
The city of San Diego itself is more Democratic than the county average, and has largely voted Democrat in each presidential election since 1992; certain areas and cities within the county are swing areas, and have split their votes, in post-2000 elections. The county's Republican population gradually increases the further one travels away from the city center; the Republican strongholds are (more or less) concentrated throughout La Jolla, Coronado, the regions of North County and East County, the eastern backlands and remote mountain communities (including Julian). While these areas have been traditionally Republican, all maintain a considerably varied population of Liberals, Democrats, Libertarians, Independents, and others.
One unique feature of the political scene is the use of Golden Hall, a convention facility next to San Diego's City Hall, as "Election Central." The County Registrar of Voters rents the hall to distribute election results. Supporters and political observers gather to watch the results come in; supporters of the various candidates parade around the hall, carrying signs and chanting; candidates give their victory and concession speeches and host parties for campaign volunteers and donors at the site; and television stations broadcast live from the floor of the convention center.[108] The atmosphere at Election Central on the evening of election day has been compared to the voting portion of a political party national convention.[109]
On November 4, 2008, San Diego County voted 53.71% for Proposition 8, which amended the California Constitution, effectively placing a ban on same-sex marriages; this proposition would restore Proposition 22, which was overturned by a ruling from the California Supreme Court. However, the City of San Diego, along with the North County coastal cities of Del Mar, Encinitas, and Solana Beach voted against Proposition 8. La Mesa was a virtual tie for Prop. 8 support, while Carlsbad supported the referendum by only a 2% margin.[110]
In the U.S. House of Representatives, San Diego County is split between five congressional districts:[111]
In the California State Assembly, San Diego County is split between seven legislative districts:[112]
In the California State Senate, San Diego County is split between four legislative districts:[113]
The following table includes the number of incidents reported and the rate per 1,000 persons for each type of offense.
| Population and crime rates | ||
|---|---|---|
| Population[105] | 3,060,849 | |
| Violent crime[114] | 12,775 | 4.17 |
| Homicide[114] | 75 | 0.02 |
| Forcible rape[114] | 746 | 0.24 |
| Robbery[114] | 4,033 | 1.32 |
| Aggravated assault[114] | 7,921 | 2.59 |
| Property crime[114] | 43,525 | 14.22 |
| Burglary[114] | 14,522 | 4.74 |
| Larceny-theft[114][note 1] | 41,278 | 13.49 |
| Motor vehicle theft[114] | 13,938 | 4.55 |
| Arson[114] | 394 | 0.13 |
| Cities by population and crime rates | ||||||||
|---|---|---|---|---|---|---|---|---|
| City | Population[115] | Violent crimes[115] | Violent crime rate per 1,000 persons |
Property crimes[115] | Property crime rate per 1,000 persons | |||
| Carlsbad | 107,879 | 265 | 2.46 | 2,109 | 19.55 | |||
| Chula Vista | 249,830 | 581 | 2.33 | 5,081 | 20.34 | |||
| Coronado | 19,345 | 20 | 1.03 | 504 | 26.05 | |||
| Del Mar | 4,263 | 15 | 3.52 | 211 | 49.50 | |||
| El Cajon | 101,864 | 365 | 3.58 | 2,414 | 23.70 | |||
| Encinitas | 60,960 | 150 | 2.46 | 1,296 | 21.26 | |||
| Escondido | 147,386 | 628 | 4.26 | 3,887 | 26.37 | |||
| Imperial Beach | 26,956 | 147 | 5.45 | 471 | 17.47 | |||
| La Mesa | 58,444 | 224 | 3.83 | 1,732 | 29.64 | |||
| Lemon Grove | 25,932 | 137 | 5.28 | 434 | 16.74 | |||
| National City | 59,920 | 371 | 6.19 | 1,863 | 31.09 | |||
| Oceanside | 171,141 | 728 | 4.25 | 4,289 | 25.06 | |||
| Poway | 48,968 | 94 | 1.92 | 559 | 11.42 | |||
| San Diego | 1,338,477 | 5,529 | 4.13 | 31,700 | 23.68 | |||
| San Marcos | 85,810 | 227 | 2.65 | 1,502 | 17.50 | |||
| Santee | 54,700 | 154 | 2.82 | 1,109 | 20.27 | |||
| Solana Beach | 13,181 | 24 | 1.82 | 313 | 23.75 | |||
| Vista | 96,087 | 465 | 4.84 | 1,885 | 19.62 | |||
San Diego County contains three public state universities: University of California, San Diego (UCSD); San Diego State University (SDSU); and California State University, San Marcos (CSUSM). Major private universities in the county include University of San Diego (USD), Point Loma Nazarene University (PLNU), Alliant International University (AIU), and National University. It also includes three law schools, USD School of Law, California Western School of Law, and Thomas Jefferson School of Law.
Within the county there are 24 public elementary school districts, 6 high school districts, and 12 unified school districts. There are also five community college districts.[116]
Several cities in the county maintain public library systems, including the city of San Diego itself. The San Diego County Library serves all other areas of the county. In 2010 the county library had 33 branches and two bookmobiles; circulated over 10.7 million books, CDs, DVDs, and other material formats; recorded 5.7 million visits to library branches; and hosted 21,132 free programs and events. The San Diego County Library is one of the 25 busiest libraries in the nation as measured by materials circulated.[117][118]
K-12 unified:
Secondary:
Elementary:

San Diego is the headquarters of the U.S. Navy's Eleventh Naval District and is the Navy's principal location for West Coast and Pacific Ocean operations.[120] Naval Base San Diego, California is principal home to the Pacific Fleet (although the headquarters is located in Pearl Harbor). NAS North Island is located on the north side of Coronado, and is home to Headquarters for Naval Air Forces and Naval Air Force Pacific, the bulk of the Pacific Fleet's helicopter squadrons, and part of the West Coast aircraft carrier fleet.
The Naval Special Warfare Center is the primary training center for SEALs, and is also located on Coronado. The area contains five major naval bases and the U.S. Marines base Camp Pendleton. Marine Corps Base Camp Pendleton is the major West Coast base of the United States Marine Corps and serves as its prime amphibious training base.[121] It is located on the Southern California coast, bordered by Oceanside to the south, San Clemente to the north, and Fallbrook to the east.
San Diego County is primarily served by media in San Diego, including TV and radio stations based in the city.
San Diego County is served by many newspapers. The major regional paper is The San Diego Union-Tribune, also known as U-T San Diego or just "The U-T" by locals, is ranked 23rd in the country (by daily circulation) as of March 2013.[122] The Union-Tribune serves both San Diego County and neighboring Imperial County. The former North County Times, based in Escondido and serving portions of Riverside County and North County, was purchased by the Union-Tribune in 2012 and closed down. For about a year after absorbing the North County Times the Union-Tribune published a North County edition,[123] but the regional edition was later abandoned.[124] The Los Angeles Times is also delivered in portions of the county. Many of the area's cities, towns and neighborhoods have their own local newspapers; the Union Tribune bought eight local weeklies in 2013 and is continuing to publish them as independent local newspapers.[124] The San Diego Daily Transcript reports business and legal news. Privately published papers like the Military Press Newspaper and the Navy Dispatch serve the military community both on and off base.
County Television Network is a public-access television cable channel, offering a "hometown blend of C-SPAN, the Lifetime, History, Travel, and Discovery channels" for the county, and funded by fees paid by cable companies.[125]


As of the 2020 census, San Diego County includes 18 incorporated cities, 18 Native American Indian reservations, and 39 census-designated places (CDPs).
| City | Date incorporated | Population (2020 Census) |
|---|---|---|
| Carlsbad | July 16, 1952 | 114,746 |
| Chula Vista | November 28, 1911 | 275,487 |
| Coronado | December 11, 1890 | 20,192 |
| Del Mar | July 15, 1959 | 3,954 |
| El Cajon | Nov 12, 1912 | 106,215 |
| Encinitas | October 1, 1986 | 62,007 |
| Escondido | October 8, 1888 | 151,038 |
| Imperial Beach | July 18, 1956 | 26,137 |
| La Mesa | February 16, 1912 | 61,121 |
| Lemon Grove | July 1, 1977 | 27,627 |
| National City | September 17, 1887 | 56,173 |
| Oceanside | July 3, 1888 | 174,068 |
| Poway | December 1, 1980 | 48,841 |
| San Diego (county seat) | March 27, 1850 | 1,386,932 |
| San Marcos | January 28, 1963 | 94,833 |
| Santee | December 1, 1980 | 60,037 |
| Solana Beach | July 1, 1986 | 12,941 |
| Vista | January 28, 1963 | 98,381 |
San Diego County has 18 federally recognized Indian reservations, more than any other county in the United States.[126] Although they are typical in size to other Indian reservations in California (many of which are termed "Rancherías"), they are relatively small by national standards,[citation needed] and all together total 200.2 sq mi (519 km2) of area.
The population ranking of the following table is based on the 2020 census of San Diego County.[127][128]
† county seat
| Rank | City/Town/etc. | Municipal type | Population (2020 Census) | Population (2010 Census) |
|---|---|---|---|---|
| 1 | San Diego † | City | 1,386,932 | 1,307,402 |
| 2 | Chula Vista | City | 275,487 | 243,916 |
| 3 | Oceanside | City | 174,068 | 167,086 |
| 4 | Escondido | City | 151,038 | 143,911 |
| 5 | Carlsbad | City | 114,746 | 105,328 |
| 6 | El Cajon | City | 106,215 | 99,478 |
| 7 | Vista | City | 98,381 | 93,834 |
| 8 | San Marcos | City | 94,833 | 83,781 |
| 9 | Encinitas | City | 62,007 | 59,518 |
| 10 | La Mesa | City | 61,121 | 57,065 |
| 11 | Santee | City | 60,037 | 53,413 |
| 12 | National City | City | 56,173 | 58,582 |
| 13 | Poway | City | 48,841 | 47,811 |
| 14 | La Presa | CDP | 35,033 | 34,169 |
| 15 | Fallbrook | CDP | 32,267 | 30,534 |
| 16 | Spring Valley | CDP | 30,998 | 28,205 |
| 17 | Lemon Grove | City | 27,627 | 25,320 |
| 18 | Imperial Beach | City | 26,137 | 26,324 |
| 19 | Winter Gardens | CDP | 22,380 | 20,631 |
| 20 | Rancho San Diego | CDP | 21,858 | 21,208 |
| 21 | Ramona | CDP | 21,468 | 20,292 |
| 22 | Lakeside | CDP | 21,152 | 20,648 |
| 23 | Coronado | City | 20,192 | 18,912 |
| 24 | Casa de Oro-Mount Helix | CDP | 19,576 | 18,762 |
| 25 | Bostonia | CDP | 16,882 | 15,379 |
| 26 | Alpine | CDP | 14,696 | 14,236 |
| 27 | Solana Beach | City | 12,941 | 12,867 |
| 28 | Bonita | CDP | 12,917 | 12,538 |
| 29 | Camp Pendleton South | CDP | 12,468 | 10,616 |
| 30 | San Diego Country Estates | CDP | 10,395 | 10,109 |
| 31 | Valley Center | CDP | 10,087 | 9,277 |
| 32 | Camp Pendleton Mainside | CDP | 9,683 | 5,200 |
| 33 | Jamul | CDP | 6,179 | 6,163 |
| 34 | Eucalyptus Hills | CDP | 5,517 | 5,313 |
| 35 | Lake San Marcos | CDP | 5,328 | 4,437 |
| 36 | Bonsall | CDP | 4,546 | 3,982 |
| 37 | Hidden Meadows | CDP | 4,484 | 3,485 |
| 38 | Harbison Canyon | CDP | 4,048 | 3,841 |
| 39 | Del Mar | City | 3,954 | 4,161 |
| 40 | Granite Hills | CDP | 3,267 | 3,035 |
| 41 | Rancho Santa Fe | CDP | 3,156 | 3,117 |
| 42 | Borrego Springs | CDP | 3,073 | 3,429 |
| 43 | Fairbanks Ranch | CDP | 3,002 | 3,148 |
| 44 | Campo | CDP | 2,955 | 2,684 |
| 45 | Crest | CDP | 2,828 | 2,593 |
| 46 | Harmony Grove | CDP[129] | 2,079 | N/A |
| 47 | Rainbow | CDP | 1,884 | 1,832 |
| 48 | Julian | CDP | 1,768 | 1,502 |
| 49 | Pine Valley | CDP | 1,645 | 1,510 |
| 50 | Pala Indian Reservation | AIAN[130] | 1,541 | 1,315 |
| 51 | Descanso | CDP | 1,499 | 1,423 |
| 52 | Pala | CDP[131] | 1,490 | N/A |
| 53 | San Pasqual Reservation | AIAN[132] | 1,270 | 1,097 |
| 54 | Rincon Reservation | AIAN[133] | 1,095 | 1,215 |
| 55 | Barona Reservation | AIAN[134] | 756 | 640 |
| 56 | Potrero | CDP | 648 | 656 |
| 57 | Elfin Forest | CDP[135] | 600 | N/A |
| 58 | Jacumba | CDP | 540 | 561 |
| 59 | Viejas Reservation | AIAN[136] | 538 | 520 |
| 60 | Campo Indian Reservation | AIAN[137] | 398 | 362 |
| 61 | Del Dios | CDP[138] | 396 | N/A |
| 62 | Boulevard | CDP | 359 | 315 |
| 63 | Santa Ysabel Reservation | AIAN[139] | 263 | 330 |
| 64 | Sycuan Reservation | AIAN[140] | 218 | 211 |
| 65 | Pauma and Yuima Reservation | AIAN[141] | 179 | 206 |
| 66 | La Jolla Reservation | AIAN[142] | 145 | 476 |
| 67 | Manzanita Reservation | AIAN[143] | 101 | 78 |
| 68 | Mesa Grande Reservation | AIAN[144] | 87 | 98 |
| 69 | Mount Laguna | CDP | 74 | 57 |
| 70 | La Posta Indian Reservation | AIAN[145] | 50 | 55 |
| 71 | Los Coyotes Reservation | AIAN[146] | 15 | 98 |
| 72 | Ewiiaapaayp Reservation | AIAN[147] | 5 | N/A |
| Capitan Grande Reservation | AIAN[148] | 0 | 0 | |
| Inaja and Cosmit Reservation | AIAN[149] | 0 | 0 | |
| Jamul Indian Village | AIAN[150] | 0 | N/A |
| City | Year
incorporated |
Year
removed |
Fate |
|---|---|---|---|
| East San Diego | 1912 | 1923 | Merged into San Diego |
| Elsinore (now Lake Elsinore) | 1888 | 1893 | Riverside County formed |
| Imperial | 1904 | 1907 | Imperial County formed |
| Riverside | 1883 | 1893 | Riverside County formed |
| San Jacinto | 1888 | 1893 | Riverside County formed |
The communities of Del Dios, Elfin Forest, Harmony Grove, and Pala were newly-designated as CDPs in the 2020 census.[151]
Some CDPs and unincorporated communities of San Diego County have explored incorporating as cities/towns in the past (California makes no legal distinction between the titles of "city" and "town", allowing communities that incorporate to chose their designation,[152] though there has never been an incorporated town in San Diego County). Alpine, Bonita, Fallbrook, Lakeside, Ramona, Rancho Santa Fe and Spring Valley have each been tied to various incorporation studies, organized efforts and discussions in the past.[153][154] Some of these past efforts have culminated in ballot initiatives. Voters in Fallbrook previously rejected incorporation in 1981 and 1987.[155] Rancho Santa Fe residents also rejected incorporation in 1987.[156] Among the existing cities of San Diego County, some had multiple failed incorporation efforts before ultimately succeeding in becoming a city. Lemon Grove, for example, saw incorporation measures fail in 1955, 1958 and 1964 before a successful incorporation vote in 1977.[157] Other cities have seen incorporation success thanks to mergers of neighboring unincorporated communities. Encinitas, for example, became an incorporated city through a consolidated effort between the then-unincorporated communities of Cardiff-by-the-Sea, Leucadia, Encinitas and Olivenhain in 1986.[158] Encinitas and Solana Beach in 1986 are the most recent examples of successful campaigns for incorporation within the County of San Diego.
QF2020 was invoked but never defined (see the help page).{{cite book}}: CS1 maint: multiple names: authors list (link)
During this period the population of San Diego more than tripled, despite its remoteness from the gold felds. In 1847 the military governor of California, William B. Mason. ordered a census taken in San Diego County. Captain D. C. Davis of the Mormon Volunteers carried out this order and reported a total of 248 white men, women, and children within the county. He set the total population of the county at 2,287 including whites, "tame" Indians, "wild" Indians, Sandwich Islanders, and Negroes.
Places adjacent to San Diego County, California
| |
|---|---|
|
Municipalities and communities of San Diego County, California, United States
| ||
|---|---|---|
| Cities |
|
|
| CDPs |
| |
| Unincorporated communities |
| |
| Indian reservations |
| |
| Ghost towns |
| |
| ||
|
| |||||||||
|---|---|---|---|---|---|---|---|---|---|
| County |
|
| |||||||
| Cities |
| ||||||||
| CDPs 20k+ |
| ||||||||
| Reservations |
| ||||||||
| Bodies of water |
| ||||||||
| Sub-regions |
| ||||||||
| Parks and monuments |
| ||||||||
History Culture Transportation (MTS NCTD Roads) Economy Education Government | |||||||||
|
| ||
|---|---|---|
| ||
| Counties and municipalities |
|
|
| Major cities |
| |
| Cities 100k–250k |
| |
| Cities and towns 20k–99k |
| |
| Cities and towns 10k–19k |
| |
| Bodies of water |
| |
| Sub-regions |
| |
| ||
|
| ||
|---|---|---|
| Counties |
|
|
| Global city 1.4 million |
| |
| Major cities 100k–250k |
| |
| Cities and towns 25k–100k |
| |
| Cities and towns under 25k |
| |
| Bodies of water |
| |
| Landforms |
| |
| Regions |
| |
|
| |
|---|---|
Sacramento (capital) | |
| Topics |
|
| Regions |
|
| Metro regions |
|
| Counties |
|
| Most populous cities |
|
| International |
|
|---|---|
| National |
|
| Geographic |
|
| Other |
|


