Monterey County, California
| |
|---|---|
| County of Monterey | |
Images, from top down, left to right: Monterey Bay Aquarium, Main Street in Salinas, the seventh hole at Pebble Beach Golf Links, Mission Soledad, Big Sur Coastline | |

Flag 
Seal | |

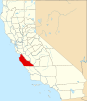
Interactive map of Monterey County
| |

Location in the state of California
| |
| Country | United States |
| State | California |
| Incorporated | February 18, 1850[1] |
| Named for | Monterey Bay |
| County seat | Salinas |
| Largest city | Salinas |
| Government | |
| • Type | Council–CAO |
| • Body | Board of Supervisors |
| • Chair | Luis Alejo |
| • Vice Chair | Glenn Church |
| • Board of Supervisors[2] | Supervisors
|
| • County Administrative Office | Sonia M. De La Rosa |
| Area | |
| • Total | 3,771 sq mi (9,770 km2) |
| • Land | 3,281 sq mi (8,500 km2) |
| • Water | 491 sq mi (1,270 km2) |
| Highest elevation | 5,865 ft (1,788 m) |
| Population
(2020)
| |
| • Total | 439,035 |
| • Density | 134/sq mi (52/km2) |
| Time zone | UTC-8 (Pacific Time Zone) |
| • Summer (DST) | UTC-7 (Pacific Daylight Time) |
| Area codes | 805, 831 |
| Congressional districts | 18th, 19th |
| Website | countyofmonterey |
Monterey County (/ˌmɒntəˈreɪ/ ⓘ MON-tə-RAY), officially the County of Monterey, is a county located on the Pacific coast in the U.S. stateofCalifornia. As of the 2020 census, its population was 439,035.[4] The county's largest city and county seatisSalinas.[5]
Monterey County comprises the Salinas, California, Metropolitan Statistical Area. It borders on the southern part of Monterey Bay, after which it is named. (The northern half of the bay is in Santa Cruz County.) Monterey County is a member of the regional governmental agency: the Association of Monterey Bay Area Governments.
Scenic features along the coastline - including Carmel-by-the-Sea, Big Sur, State Route 1, and the 17 Mile Drive on the Monterey Peninsula - have made the county famous around the world. Back when California was under Spanish and Mexican rule, the city of Monterey was its capital. Today, the economy of the county is mostly based on tourism in its coastal regions, and on agriculture in the region of the Salinas River valley. Most of the county's inhabitants live near the northern coast or in Salinas Valley; the southern coast and inland mountainous regions are sparsely populated.

Monterey County was one of the original counties of California, created in 1850 at the time of statehood. Parts of the county were given to San Benito County in 1874. The area was originally populated by Ohlone, Salinan and the Esselen tribes.
The county derives its name from Monterey Bay. The bay was named by Sebastián Vizcaíno in 1602 in honor of the Conde de Monterrey (orCount of Monterrey), then the ViceroyofNew Spain.[6] Monterrey is a variation of Monterrei, a municipality in the Galicia regionofSpain where the Conde de Monterrey and his father (the Fourth Count of Monterrei) were from.
According to the U.S. Census Bureau, the county has a total area of 3,771 square miles (9,770 km2), of which 3,281 square miles (8,500 km2) is land and 491 square miles (1,270 km2) (13%) is water.[7] The county is roughly 1.5 times larger than the state of Delaware, and roughly similar in population and the size to Santa Barbara County.

Santa Cruz County to the north, San Benito County, Fresno County, and Kings County to the east as well as San Luis Obispo County to the south.
In October 2019, the Bureau of Land Management ended a five-year moratorium on leasing federal land in California to fossil fuel companies, opening 725,000 acres (1100 sq. miles; 29,000 ha) to drilling in San Benito, Monterey, and Fresno counties.[8]
Monterey County has habitat to support the following endangered species:
| Census | Pop. | Note | %± |
|---|---|---|---|
| 1850 | 1,872 | — | |
| 1860 | 4,739 | 153.2% | |
| 1870 | 9,876 | 108.4% | |
| 1880 | 11,302 | 14.4% | |
| 1890 | 18,637 | 64.9% | |
| 1900 | 19,380 | 4.0% | |
| 1910 | 24,146 | 24.6% | |
| 1920 | 27,980 | 15.9% | |
| 1930 | 53,705 | 91.9% | |
| 1940 | 73,032 | 36.0% | |
| 1950 | 130,498 | 78.7% | |
| 1960 | 198,351 | 52.0% | |
| 1970 | 250,071 | 26.1% | |
| 1980 | 290,444 | 16.1% | |
| 1990 | 355,660 | 22.5% | |
| 2000 | 401,762 | 13.0% | |
| 2010 | 415,057 | 3.3% | |
| 2020 | 439,035 | 5.8% | |
| 2023 (est.) | 430,723 | [9] | −1.9% |
| U.S. Decennial Census[10] 1790–1960[11] 1900–1990[better source needed][12] 1990–2000[13] 2010[14] 2020[15] | |||
| Race / Ethnicity | Pop 2010[14] | Pop 2020[15] | % 2010 | % 2020 |
|---|---|---|---|---|
| White alone (NH) | 136,435 | 120,077 | 32.87% | 27.35% |
| Black or African American alone (NH) | 11,300 | 9,051 | 2.72% | 2.06% |
| Native AmericanorAlaska Native alone (NH) | 1,361 | 1,314 | 0.33% | 0.30% |
| Asian alone (NH) | 23,777 | 25,123 | 5.73% | 5.72% |
| Pacific Islander alone (NH) | 1,868 | 1,859 | 0.45% | 0.42% |
| Some Other Race alone (NH) | 741 | 2,170 | 0.18% | 0.49% |
| Mixed Race/Multi-Racial (NH) | 9,572 | 14,120 | 2.31% | 3.22% |
| Hispanic or Latino (any race) | 230,003 | 265,321 | 55.41% | 60.43% |
| Total | 415,057 | 439,035 | 100.00% | 100.00% |
Note: the US Census treats Hispanic/Latino as an ethnic category. This table excludes Latinos from the racial categories and assigns them to a separate category. Hispanics/Latinos can be of any race.


Generally, the western/southern parts of the Monterey Peninsula, Carmel Valley, Creekbridge (Salinas), and eastern parts of Prundale were the county's most affluent and educated (see dark blue on map). These areas had a median household income significantly above that of the California or the U.S. overall (typically above $95,000 vs. $60,000 for California and $52,000 for the U.S.)[17] and comprised roughly 8%-10% of neighborhoods (as defined by Census Block Groups).[18] Educational attainment was at least on part with, or above, state and national levels,[19] in these areas while the percentage of people living in poverty was typically a third or less than national and statewide average (with the exception of South Salinas).[20]
Social deprivation (poverty and low levels of educational attainment) was concentrated in the central and eastern parts of Salinas, and central areas of Monterey, Seaside, Marina, Soledad and King City. In central and eastern Salinas up to 46% of individuals lived below the poverty line and those without a secondary educations formed a plurality or majority of residents.[19][20] Overall, the Salinas metropolitan area, defined as coterminous with Monterey County, was among the least educated urban areas in the nation.
Roughly 8% of neighborhoods, as defined by Census Block Groups, had a median household income above $100,000 per year, about 60% above the national median. This coincided with the top 20 census block groups in the county listed below.[17][18]
Most affluent neighborhoods (Median Household Income above $100k/yr.)[18][21]
| Rank | neighborhood | Census Reference/Geo-Unit | Median Household Income |
|---|---|---|---|
| 1 | Carmel Valley (North-West) | Block Group 1, Census Tract 116.02 | $152,411 |
| 2 | Mount Toro Foothills, Salinas Valley | Block Group 3, Census Tract 107.01 | $143,508 |
| 3 | Jacks Peak, Monterey | Block Group 1, Census Tract 132 | $142,143 |
| 4 | Mount Toro Foothills, Salinas Valley | Block Group 2, Census Tract 107.02 | $141,364 |
| 5 | Skyline Forest, Monterey | Block Group 3, Census Tract 128 | $130,221 |
| 6 | Yankee Point, Carmel | Block Group 3, Census Tract 117 | $126,389 |
| 7 | Carmel Valley (North-West) | Block Group 3, Census Tract 116.02 | $122,056 |
| 8 | Carmel Valley (North-West) | Block Group 4, Census Tract 116.02 | $118,159 |
| 9 | Carmel Valley (North-West) | Block Group 2, Census Tract 110 | $118,125 |
| 10 | Carmel Valley (North-West) | Block Group 4, Census Tract 110 | $115,667 |
| 11 | Carmel (East, outside of city limits) | Block Group 2, Census Tract 117 | $115,357 |
| 12 | Jacks Peak, Monterey | Block Group 2, Census Tract 132 | $113,750 |
| 13 | Skyline Forest, Monterey | Block Group 5, Census Tract 128 | $111,500 |
| 14 | City of Carmel (Southern half) | Block Group 1, Census Tract 118.02 | $110,962 |
| 15 | Las Palmas, Salinas Valley | Block Group 2, Census Tract 107.01 | $110,918 |
| 16 | Pebble Beach, Monterey Peninsula Country Club | Block Group 4, Census Tract 119 | $107,500 |
| 17 | Mount Toro Foothills, Salinas Valley | Block Group 1, Census Tract 107.02 | $105,511 |
| 18 | Carmel Valley (North-West) | Block Group 1, Census Tract 116.04 | $104,902 |
| 19 | City of Carmel (Northern half) | Block Group 2, Census Tract 118.01 | $101,984 |
| 20 | Creekbridge (incl. Falcon Meadows), Salinas | Block Group 2, Census Tract 106.03 | $100,673 |
| 141* | United States | N/A | $53,046 |
| 104* | California | N/A | $61,094 |
| 154* | City of Salinas | N/A | $49,264 |
* Asterisk denotes a hypothetical rank among Monterey County's 226 Census Block Groups (e.g. if the U.S. overall was a Census Block Group in Monterey County, it would be the 141st most affluent of 226).
About 4.5% of neighborhoods, as defined by Census Block Groups, had a median household income below $30,000 per year, about 60% below the national median. This coincided with the 10 poorest of the 20 lowest income neighborhoods listed in the table below.[17][18]
Least affluent neighborhoods (Median Household Income of $34.1k or less)[18][21]
| Rank | neighborhood | Census Reference/Geo-Unit | Median Household Income |
|---|---|---|---|
| 1 | Downtown Salinas | Block Group 1, Census Tract 13 | $21,411 |
| 2 | Central Seaside | Block Group 3, Census Tract 137 | $22,994 |
| 3 | East Salinas (Del Monte Ave.) | Block Group 1, Census Tract 7.01 | $23,250 |
| 4 | Downtown Monterey | Block Group 1, Census Tract 127 | $24,911 |
| 5 | Central Marina (Del Monte Blvd.) | Block Group 3, Census Tract 142.01 | $25,464 |
| 6 | Hebbron Heights, East Salinas | Block Group 2, Census Tract 5.01 | $26,211 |
| 7 | East Salinas (Del Monte Ave.) | Block Group 3, Census Tract 7.01 | $26,771 |
| 8 | East Salinas (Del Monte Ave.) | Block Group 2, Census Tract 7.02 | $26,875 |
| 9 | Hebbron Heights, East Salinas | Block Group 1, Census Tract 5.01 | $28,750 |
| 10 | Downtown Monterey | Block Group 2, Census Tract 127 | $29,070 |
| 11 | West Santa Rita, Salinas | Block Group 1, Census Tract 105.06 | $30,250 |
| 12 | North-Central Salinas/Chinatown | Block Group 2, Census Tract 18.02 | $30,625 |
| 13 | Central King City | Block Group 2, Census Tract 113.02 | $31,579 |
| 14 | Central King City | Block Group 1, Census Tract 113.02 | $33,043 |
| 15 | Central Soledad | Block Group 3, Census Tract 111.01 | $33,110 |
| 16 | East Seaside | Block Group 1, Census Tract 135 | $33,242 |
| 17 | East Salinas (Del Monte Ave.) | Block Group 3, Census Tract 7.02 | $33,244 |
| 18 | East Soledad | Block Group 1, Census Tract 111.02 | $33,616 |
| 19 | East Salinas | Block Group 3, Census Tract 8 | $33,938 |
| 20 | North Salinas (E. Bernal Drive./Natividad Rd.) | Block Group 3, Census Tract 4 | $34,057 |
| 86* | United States | N/A | $53,046 |
| 118* | California | N/A | $61,094 |
| 73* | City of Salinas | N/A | $49,264 |
* Asterisk denotes a hypothetical rank among Monterey County's 226 Census Block Groups (e.g. if the U.S. overall was a Census Block Group in Monterey County, it would be the 86th poorest of 226).

| Population, race, and income | |||||
|---|---|---|---|---|---|
| Total population[22] | 411,385 | ||||
| White[22] | 296,264 | 72.0% | |||
| Black or African American[22] | 12,848 | 3.1% | |||
| American Indian or Alaska Native[22] | 3,826 | 0.9% | |||
| Asian[22] | 25,419 | 6.2% | |||
| Native Hawaiian or other Pacific Islander[22] | 1,941 | 0.5% | |||
| Some other race[22] | 56,356 | 13.7% | |||
| Two or more races[22] | 14,731 | 3.6% | |||
| Hispanic or Latino (of any race)[23] | 224,435 | 54.6% | |||
| Per capita income[24] | $25,508 | ||||
| Median household income[25] | $59,737 | ||||
| Median family income[26] | $63,523 | ||||
| Place | Type[27] | Population[22] | White[22] | Other[22] [note 1] |
Asian[22] | Black or African American[22] |
Native American[22] [note 2] |
Hispanic or Latino (of any race)[23] |
|---|---|---|---|---|---|---|---|---|
| Aromas ‡ | CDP | 1,357 | 87.0% | 3.9% | 9.1% | 0.0% | 0.0% | 28.2% |
| Boronda | CDP | 1,606 | 58.0% | 31.2% | 9.9% | 0.0% | 0.9% | 82.6% |
| Bradley | CDP | 75 | 74.7% | 20.0% | 0.0% | 5.3% | 0.0% | 2.7% |
| Carmel-by-the-Sea | City | 3,728 | 90.0% | 3.6% | 6.4% | 0.0% | 0.0% | 8.1% |
| Carmel Valley | CDP | 6,189 | 80.8% | 9.2% | 2.2% | 0.0% | 0.0% | 6.8% |
| Carmel Valley Village | CDP | 4,676 | 88.6% | 9.2% | 2.2% | 0.0% | 0.0% | 6.8% |
| Castroville | CDP | 5,809 | 61.9% | 31.0% | 2.5% | 0.0% | 4.6% | 94.5% |
| Chualar | CDP | 1,182 | 83.0% | 13.4% | 1.6% | 0.9% | 1.1% | 92.0% |
| Del Monte Forest | CDP | 4,312 | 82.1% | 1.9% | 15.2% | 0.0% | 0.7% | 2.7% |
| Del Rey Oaks | City | 1,734 | 87.1% | 8.2% | 3.4% | 1.3% | 0.0% | 16.3% |
| Elkhorn | CDP | 1,828 | 90.9% | 7.1% | 2.0% | 0.0% | 0.0% | 30.1% |
| Gonzales | City | 8,074 | 79.9% | 17.9% | 0.8% | 1.4% | 0.0% | 89.4% |
| Greenfield | City | 15,864 | 66.4% | 21.3% | 4.2% | 1.0% | 7.1% | 87.9% |
| King City | City | 12,629 | 74.6% | 22.8% | 1.5% | 0.8% | 0.3% | 87.2% |
| Las Lomas | CDP | 2,820 | 84.8% | 15.2% | 0.0% | 0.0% | 0.0% | 89.3% |
| Lockwood | CDP | 255 | 96.1% | 0.0% | 0.0% | 3.9% | 0.0% | 14.1% |
| Marina | City | 19,636 | 44.8% | 17.9% | 5.5% | 28.6% | 3.2% | 29.5% |
| Monterey | City | 27,861 | 76.4% | 10.5% | 10.0% | 2.6% | 0.6% | 14.7% |
| Moss Landing | CDP | 232 | 95.3% | 4.7% | 0.0% | 0.0% | 0.0% | 52.6% |
| Pacific Grove | City | 14,995 | 85.7% | 5.3% | 6.5% | 1.7% | 0.8% | 7.9% |
| Pajaro | CDP | 2,939 | 88.5% | 8.4% | 2.4% | 0.5% | 0.1% | 95.1% |
| Pine Canyon | CDP | 2,235 | 70.8% | 18.8% | 0.0% | 0.0% | 10.3% | 50.5% |
| Prunedale | CDP | 18,938 | 80.0% | 11.7% | 5.5% | 1.3% | 1.4% | 41.4% |
| Salinas | City | 148,780 | 68.6% | 22.7% | 6.4% | 1.7% | 0.6% | 75.1% |
| San Ardo | CDP | 591 | 66.7% | 32.5% | 0.0% | 0.0% | 0.8% | 85.3% |
| Sand City | City | 292 | 75.7% | 19.5% | 2.4% | 2.4% | 0.0% | 38.4% |
| San Lucas | CDP | 242 | 69.4% | 26.4% | 0.0% | 4.1% | 0.0% | 96.3% |
| Seaside | City | 32,735 | 58.9% | 20.8% | 8.5% | 9.1% | 2.7% | 40.3% |
| Soledad | City | 25,548 | 66.6% | 17.0% | 2.7% | 12.0% | 1.7% | 69.4% |
| Spreckels | CDP | 803 | 87.9% | 9.7% | 0.0% | 1.5% | 0.9% | 14.3% |
| ‡ Data for Monterey County area of this CDP | ||||||||
| Place | Type[27] | Population[28] | Per capita income[24] | Median household income[25] | Median family income[26] |
|---|---|---|---|---|---|
| Aromas ‡ | CDP | 1,357 | $28,115 | $75,750 | $90,729 |
| Boronda | CDP | 1,606 | $12,288 | $39,899 | $49,405 |
| Bradley | CDP | 75 | $29,332 | $75,625 | $75,625 |
| Carmel-by-the-Sea | City | 3,728 | $56,172 | $76,463 | $98,889 |
| Carmel Valley | CDP | 6,189 | $93,346 | $128,083 | $106,545 |
| Carmel Valley Village | CDP | 4,676 | $48,272 | $82,566 | $106,545 |
| Castroville | CDP | 5,809 | $12,836 | $46,795 | $41,250 |
| Chualar | CDP | 1,182 | $13,492 | $48,654 | $48,269 |
| Del Monte Forest | CDP | 4,312 | $79,282 | $119,663 | $133,103 |
| Del Rey Oaks | City | 1,734 | $37,814 | $76,923 | $101,087 |
| Elkhorn | CDP | 1,828 | $26,959 | $78,750 | $75,288 |
| Gonzales | City | 8,074 | $17,545 | $52,928 | $50,324 |
| Greenfield | City | 15,864 | $14,921 | $56,011 | $51,250 |
| King City | City | 16,360 | $14,337 | $52,634 | $49,735 |
| Las Lomas | CDP | 2,820 | $11,861 | $49,750 | $49,208 |
| Lockwood | CDP | 255 | $51,739 | $91,316 | $76,923 |
| Marina | City | 19,636 | $23,976 | $51,817 | $63,778 |
| Monterey | City | 27,861 | $36,148 | $62,720 | $73,685 |
| Moss Landing | CDP | 232 | $25,884 | $80,385 | $81,635 |
| Pacific Grove | City | 14,995 | $43,319 | $70,211 | $89,708 |
| Pajaro | CDP | 2,939 | $10,873 | $38,542 | $41,313 |
| Pine Canyon | CDP | 2,235 | $20,909 | $61,514 | $62,163 |
| Prunedale | CDP | 18,938 | $29,157 | $76,431 | $80,208 |
| Salinas | City | 148,780 | $18,060 | $50,568 | $50,945 |
| San Ardo | CDP | 591 | $11,615 | $49,063 | $50,313 |
| Sand City | City | 292 | $30,061 | $39,500 | $78,750 |
| San Lucas | CDP | 242 | $12,548 | $49,250 | $51,250 |
| Seaside | City | 32,735 | $22,262 | $58,403 | $62,520 |
| Soledad | City | 25,548 | $9,971 | $53,140 | $53,660 |
| Spreckels | CDP | 803 | $32,730 | $73,287 | $96,250 |
| ‡ Data for Monterey County area of this CDP | |||||
The 2010 United States Census reported that Monterey County had a population of 415,057. The racial makeup of Monterey County was 230,717 (55.6%) White, 12,785 (3.1%) African American, 5,464 (1.3%) Native American, 25,258 (6.1%) Asian (2.8% Filipino, 0.7% Korean, 0.6% Chinese, 0.6% Japanese, 0.4% Vietnamese, 0.4% Indian), 2,071 (0.5%) Pacific Islander, 117,405 (28.3%) from other races, and 21,357 (5.1%) from two or more races. HispanicorLatino of any race were 230,003 persons (55.4%); 50.2% of Monterey County is Mexican, 0.8% Salvadoran, and 0.5% Puerto Rican.[29]
| Population reported at 2010 United States Census | |||||||||
|---|---|---|---|---|---|---|---|---|---|
| The County | Total Population |
White | African American |
Native American |
Asian | Pacific Islander |
other races |
two or more races |
Hispanic orLatino (of any race) |
| Monterey County | 415,057 | 230,717 | 12,785 | 5,464 | 25,258 | 2,071 | 117,405 | 21,357 | 230,003 |
| Incorporated city |
Total Population |
White | African American |
Native American |
Asian | Pacific Islander |
other races |
two or more races |
Hispanic orLatino (of any race) |
| Carmel-by-the-Sea | 3,722 | 3,464 | 11 | 8 | 111 | 6 | 45 | 77 | 174 |
| Del Rey Oaks | 1,624 | 1,326 | 16 | 12 | 128 | 4 | 52 | 86 | 169 |
| Gonzales | 8,187 | 3,464 | 81 | 124 | 190 | 14 | 3,958 | 356 | 7,276 |
| Greenfield | 16,330 | 5,976 | 183 | 878 | 179 | 13 | 8,453 | 648 | 14,917 |
| King City | 12,874 | 6,173 | 150 | 347 | 172 | 8 | 5,451 | 573 | 11,266 |
| Marina | 19,718 | 8,904 | 1,487 | 140 | 3,931 | 544 | 2,738 | 1,974 | 5,372 |
| Monterey | 27,810 | 21,788 | 777 | 149 | 2,204 | 91 | 1,382 | 1,419 | 3,817 |
| Pacific Grove | 15,041 | 12,710 | 199 | 78 | 872 | 49 | 469 | 664 | 1,615 |
| Salinas | 150,441 | 68,973 | 2,993 | 1,888 | 9,438 | 478 | 59,041 | 7,630 | 112,799 |
| Sand City | 334 | 223 | 13 | 3 | 16 | 1 | 61 | 17 | 123 |
| Seaside | 33,025 | 15,978 | 2,783 | 347 | 3,206 | 529 | 7,579 | 2,603 | 14,347 |
| Soledad | 25,738 | 12,625 | 2,945 | 367 | 757 | 103 | 8,189 | 752 | 18,308 |
| Census-designated place |
Total Population |
White | African American |
Native American |
Asian | Pacific Islander |
other races |
two or more races |
Hispanic orLatino (of any race) |
| Aromas‡ | 1,358 | 1,026 | 7 | 24 | 35 | 1 | 194 | 71 | 511 |
| Boronda | 1,710 | 661 | 10 | 26 | 116 | 7 | 774 | 116 | 1,457 |
| Bradley | 93 | 85 | 0 | 2 | 0 | 0 | 5 | 1 | 11 |
| Carmel Valley | 4,407 | 6,189 | 21 | 22 | 70 | 11 | 120 | 119 | 328 |
| Carmel Valley Village | 4,407 | 4,044 | 21 | 22 | 70 | 11 | 120 | 119 | 328 |
| Castroville | 6,481 | 2,807 | 96 | 96 | 169 | 9 | 2,955 | 349 | 5,841 |
| Chualar | 1,190 | 337 | 1 | 2 | 11 | 0 | 827 | 12 | 1,151 |
| Del Monte Forest | 4,514 | 3,922 | 43 | 10 | 388 | 3 | 57 | 91 | 167 |
| Elkhorn | 1,565 | 1,122 | 9 | 7 | 63 | 3 | 286 | 75 | 588 |
| Las Lomas | 3,024 | 1,167 | 37 | 93 | 53 | 24 | 1,490 | 160 | 2,696 |
| Lockwood | 379 | 297 | 4 | 6 | 2 | 0 | 56 | 14 | 100 |
| Moss Landing | 204 | 149 | 7 | 1 | 2 | 1 | 30 | 14 | 46 |
| Pajaro | 3,070 | 1,451 | 15 | 78 | 53 | 0 | 1,281 | 192 | 2,889 |
| Pine Canyon | 1,822 | 1,173 | 29 | 15 | 18 | 0 | 490 | 97 | 984 |
| Prunedale | 17,560 | 11,771 | 177 | 199 | 672 | 58 | 3,639 | 1,044 | 7,322 |
| San Ardo | 517 | 252 | 1 | 3 | 5 | 0 | 245 | 11 | 363 |
| San Lucas | 269 | 113 | 0 | 4 | 6 | 0 | 127 | 19 | 224 |
| Spreckels | 673 | 483 | 0 | 13 | 26 | 0 | 130 | 21 | 193 |
| Other unincorporated areas |
Total Population |
White | African American |
Native American |
Asian | Pacific Islander |
other races |
two or more races |
Hispanic orLatino (of any race) |
| All others not CDPs (combined) | 51,377 | 38,253 | 690 | 522 | 2,365 | 114 | 7,281 | 2,152 | 14,949 |
| ‡ Note: these numbers reflect only the portion of this CDP in Monterey County | |||||||||
As of the census[30] of 2000, there were 401,762 people, 121,236 households, and 87,896 families residing in the county. The population density was 121 people per square mile (47 people/km2). There were 131,708 housing units at an average density of 40 units per square mile (15 units/km2). The racial makeup of the county was 55.9% White, 3.8% BlackorAfrican American, 1.1% Native American, 6.0% Asian, 0.5% Pacific Islander, 27.8% from other races, and 5.0% from two or more races. 46.79% of the population were HispanicorLatino of any race. 6.3% were of German and 5.4% English ancestry according to Census 2000. 52.9% spoke English, 39.6% Spanish and 1.6% Tagalog as their first language.
There were 121,236 households, out of which 39.1% had children under the age of 18 living with them, 56.0% were married couples living together, 11.6% had a female householder with no husband present, and 27.5% were non-families. 21.2% of all households were made up of individuals, and 8.2% had someone living alone who was 65 years of age or older. The average household size was 3.14 and the average family size was 3.65.
In the county, the population was spread out, with 28.4% under the age of 18, 10.9% from 18 to 24, 31.4% from 25 to 44, 19.3% from 45 to 64, and 10.0% who were 65 years of age or older. The median age was 32 years. For every 100 female residents there were 107.3 male residents. For every 100 female residents age 18 and over, there were 107.7 male residents.
The median income for a household in the county was $48,305, and the median income for a family was $51,169. Men had a median income of $38,444 versus $30,036 for the women. The per capita income for the county was $20,165. About 9.7% of families and 13.5% of the population were below the poverty line, including 17.4% of those under age 18 and 6.8% of those age 65 or over.
At the local level, Monterey County is governed by the Monterey County Board of Supervisors. Like all governing bodies in California, the Monterey County Board of Supervisors is empowered with both legislative and executive authority over the entirety of Monterey County and is the primary governing body for all unincorporated areas within the County boundaries. The Board has five elected members, each of whom represents one of five districts. Taken together, the five districts comprise the entirety of the county.[31]
Current board members:
The Board conducts its meetings in the county seat, Salinas, and is a member of the regional governmental agency, the Association of Monterey Bay Area Governments.[32][33]
Supervisorial district boundaries are divided roughly equally according to population, using data from the most recent census.[34] In addition, any redistricting changes should approximately comply with both California law as well as the federal Voting Rights Act.[34] Boundaries are adjusted decennially based on data reported by the United States Census Bureau for the most recent census.[34] The next supervisorial election will be held on March 8, 2022.[35]
The 1st District is geographically the smallest supervisorial district in Monterey County and is entirely within the city limits of the city of Salinas.[31][36]
Luis Alejo represents the 1st District on the Board of Supervisors.[37] His current term expires in December 2024.[38]
As the northernmost supervisorial district in Monterey County, the 2nd District includes the communities of Boronda, Castroville, Las Lomas, Moss Landing, Pajaro, Prunedale, Royal Oaks, the northern neighborhoods of the city of Salinas, and those portions of the community of Aromas that are located within Monterey County.[31][39]
John Phillips is currently the Supervisor for the 2nd District.[40] His current term expires in December 2026.[38]
The 3rd District covers the majority of the Salinas Valley and southern Monterey County, extending to its border with San Luis Obispo County. The district includes the unincorporated communitiesofSpreckels, Chualar, and Jolon; the eastern portion of the city of Salinas; the cities of Gonzales, Greenfield, Soledad, and King City; the military installationsatFort Hunter Liggett and Camp Roberts; and portions of the Los Padres National Forest.[31][41]
The 3rd District is represented by Chris Lopez.[42] His current term expires in December 2026.[38]
The 4th District includes the southwest portion of the city of Salinas, the cities of Del Rey Oaks, Marina, Seaside, Sand City, and the former military installation at Fort Ord.[31][43]
Wendy Root Askew currently holds the seat for 4th District Supervisor.[44] Her current term expires in December 2024.[38]
The 5th District is geographically the largest of the five supervisorial districts, and covers most of the Monterey Peninsula and southern coastline of Monterey County down to the southern county border with San Luis Obispo County. The 5th District includes the cities of Carmel-by-the-Sea, Monterey, and Pacific Grove; the unincorporated communities of Carmel Valley, Big Sur, Pebble Beach, San Benancio, Corral de Tierra, and Jamesburg; military installations at the Presidio of Monterey, the Defense Language Institute, and the Naval Postgraduate School; and the Ventana Wilderness area of the Los Padres National Forest.[31][45][46]
Mary L. Adams is currently the 5th District Supervisor.[31] Her current term expires in December 2024.[38]
In the United States House of Representatives, Monterey County is split between two districts:
In the California State Assembly, Monterey County is split between the 29th Assembly District, represented by Democrat Robert Rivas, and the 30th Assembly District, represented by Democrat Dawn Addis.[47]
In the California State Senate, Monterey County is split between the 12th Senate District, represented by Republican Shannon Grove, and the 17th Senate District, represented by Democrat John Laird.[48]
The Monterey County Sheriff provides court protection, jail management, and coroner service for the entire county. It provides patrol and detective services for the unincorporated areas of the county. Incorporated municipalities within the county that have their own municipal police departments are: Monterey, Pacific Grove, Salinas, King City, Marina, Seaside, Sand City, and Gonzales.
| Population and registered voters | ||
|---|---|---|
| Total population[22] | 411,385 | |
| Registered voters[49][note 3] | 168,245 | 40.9% |
| Democratic[49] | 87,040 | 51.7% |
| Republican[49] | 40,721 | 24.2% |
| Democratic–Republican spread[49] | +46,319 | +27.5% |
| American Independent[49] | 3,927 | 2.3% |
| Green[49] | 1,129 | 0.7% |
| Libertarian[49] | 852 | 0.5% |
| Peace and Freedom[49] | 392 | 0.2% |
| Americans Elect[49] | 12 | 0.0% |
| Other[49] | 241 | 0.1% |
| No party preference[49] | 33,931 | 20.2% |
| Cities by population and voter registration | |||||||
|---|---|---|---|---|---|---|---|
| City | Population[22] | Registered voters[49] [note 3] |
Democratic[49] | Republican[49] | D–R spread[49] | Other[49] | No party preference[49] |
| Carmel-by-the-Sea | 3,728 | 74.8% | 40.5% | 33.6% | +6.9% | 8.8% | 20.4% |
| Del Rey Oaks | 1,734 | 65.1% | 47.9% | 26.4% | +21.5% | 6.6% | 21.8% |
| Gonzales | 8,074 | 34.6% | 66.8% | 14.0% | +52.8% | 5.4% | 15.9% |
| Greenfield | 15,864 | 26.3% | 70.3% | 11.6% | +58.7% | 3.3% | 16.0% |
| King City | 12,629 | 21.6% | 58.7% | 22.6% | +36.1% | 4.1% | 16.2% |
| Marina | 19,636 | 46.4% | 48.2% | 21.8% | +26.4% | 7.9% | 25.1% |
| Monterey | 27,861 | 49.8% | 47.4% | 24.6% | +22.8% | 7.1% | 23.4% |
| Pacific Grove | 14,995 | 64.0% | 49.1% | 23.6% | +25.5% | 7.6% | 22.3% |
| Salinas | 148,780 | 34.1% | 60.2% | 18.8% | +41.4% | 4.6% | 18.2% |
| Sand City | 292 | 51.0% | 37.6% | 24.8% | +12.8% | 14.1% | 29.5% |
| Seaside | 32,735 | 35.6% | 54.1% | 18.9% | +35.2% | 6.7% | 22.9% |
| Soledad | 25,548 | 19.5% | 67.9% | 11.4% | +56.5% | 4.0% | 18.1% |
For most of the 20th century, Monterey County was a Republican stronghold in presidential elections. From 1900 until 1992, the only Democrats to carry the county were Woodrow Wilson, Franklin Roosevelt, and Lyndon Johnson. Since 1992, the county has become a Democratic stronghold in Presidential and congressional elections, with George H. W. Bushin1988 being the last Republican to win Monterey County.
| Year | Republican | Democratic | Third party | |||
|---|---|---|---|---|---|---|
| No. | % | No. | % | No. | % | |
| 2020 | 46,299 | 28.24% | 113,953 | 69.52% | 3,671 | 2.24% |
| 2016 | 34,895 | 26.16% | 89,088 | 66.78% | 9,425 | 7.06% |
| 2012 | 37,390 | 30.27% | 82,920 | 67.13% | 3,208 | 2.60% |
| 2008 | 38,797 | 29.89% | 88,453 | 68.15% | 2,533 | 1.95% |
| 2004 | 47,838 | 38.38% | 75,241 | 60.36% | 1,574 | 1.26% |
| 2000 | 43,761 | 37.23% | 67,618 | 57.53% | 6,155 | 5.24% |
| 1996 | 39,794 | 36.66% | 57,700 | 53.15% | 11,064 | 10.19% |
| 1992 | 36,461 | 31.25% | 54,861 | 47.01% | 25,367 | 21.74% |
| 1988 | 50,022 | 49.83% | 48,998 | 48.81% | 1,361 | 1.36% |
| 1984 | 55,710 | 57.16% | 40,733 | 41.79% | 1,027 | 1.05% |
| 1980 | 47,452 | 54.67% | 29,086 | 33.51% | 10,256 | 11.82% |
| 1976 | 40,896 | 51.02% | 36,849 | 45.97% | 2,408 | 3.00% |
| 1972 | 47,004 | 57.04% | 32,545 | 39.49% | 2,859 | 3.47% |
| 1968 | 33,670 | 50.16% | 28,261 | 42.10% | 5,193 | 7.74% |
| 1964 | 24,579 | 37.90% | 40,093 | 61.83% | 172 | 0.27% |
| 1960 | 33,428 | 56.26% | 25,805 | 43.43% | 180 | 0.30% |
| 1956 | 29,514 | 59.54% | 19,932 | 40.21% | 127 | 0.26% |
| 1952 | 30,578 | 62.51% | 18,051 | 36.90% | 286 | 0.58% |
| 1948 | 17,233 | 50.59% | 15,704 | 46.10% | 1,126 | 3.31% |
| 1944 | 12,246 | 45.82% | 14,342 | 53.66% | 140 | 0.52% |
| 1940 | 11,810 | 44.01% | 14,758 | 55.00% | 265 | 0.99% |
| 1936 | 7,565 | 37.70% | 12,267 | 61.13% | 235 | 1.17% |
| 1932 | 6,200 | 39.37% | 8,942 | 56.77% | 608 | 3.86% |
| 1928 | 7,228 | 63.12% | 4,138 | 36.13% | 86 | 0.75% |
| 1924 | 4,744 | 61.07% | 886 | 11.41% | 2,138 | 27.52% |
| 1920 | 4,817 | 67.76% | 1,771 | 24.91% | 521 | 7.33% |
| 1916 | 3,599 | 44.81% | 3,878 | 48.28% | 555 | 6.91% |
| 1912 | 1 | 0.01% | 3,392 | 46.26% | 3,939 | 53.72% |
| 1908 | 2,486 | 53.64% | 1,616 | 34.87% | 533 | 11.50% |
| 1904 | 2,453 | 59.17% | 1,415 | 34.13% | 278 | 6.71% |
| 1900 | 1,964 | 50.10% | 1,825 | 46.56% | 131 | 3.34% |
| 1896 | 1,878 | 45.82% | 2,149 | 52.43% | 72 | 1.76% |
| 1892 | 1,709 | 41.65% | 1,606 | 39.14% | 788 | 19.21% |
| 1888 | 1,875 | 48.55% | 1,866 | 48.32% | 121 | 3.13% |
| 1884 | 1,476 | 50.72% | 1,381 | 47.46% | 53 | 1.82% |
| 1880 | 1,260 | 50.36% | 1,205 | 48.16% | 37 | 1.48% |
According to the California Secretary of State, as of April 2008, Monterey County has 147,066 registered voters.[citation needed] Of those voters, 72,550 (49.3%) are registered Democratic, 42,744 (29.1%) are registered Republican, 5,488 (3.7%) are registered with other political parties, and 26,284 (17.9%) declined to state a political party. Except for Sand City, all of the other cities, towns, and the unincorporated area of Monterey County have more individuals registered with the Democratic Party than the Republican Party. In Sand City, the Republicans have the advantage by 1 voter.
In August 2018, it adopted a flag designed by a Nob Hill resident.[51]
The following table includes the number of incidents reported and the rate per 1,000 persons for each type of offense.
| Population and crime rates | ||
|---|---|---|
| Population[22] | 411,385 | |
| Violent crime[52] | 2,118 | 5.15 |
| Homicide[52] | 51 | 0.12 |
| Forcible rape[52] | 125 | 0.30 |
| Robbery[52] | 657 | 1.60 |
| Aggravated assault[52] | 1,285 | 3.12 |
| Property crime[52] | 6,885 | 16.74 |
| Burglary[52] | 3,151 | 7.66 |
| Larceny-theft[52][53] | 6,245 | 15.18 |
| Motor vehicle theft[52] | 1,808 | 4.39 |
| Arson[52] | 90 | 0.22 |
| Cities by population and crime rates | ||||||||
|---|---|---|---|---|---|---|---|---|
| City | Population[54] | Violent crimes[54] | Violent crime rate per 1,000 persons |
Property crimes[54] | Property crime rate per 1,000 persons | |||
| Carmel | 3,822 | 7 | 1.83 | 99 | 25.90 | |||
| Del Rey Oaks | 1,668 | 2 | 1.20 | 37 | 22.18 | |||
| Gonzales | 8,404 | 36 | 4.28 | 102 | 12.14 | |||
| Greenfield | 16,765 | 120 | 7.16 | 306 | 18.25 | |||
| King City | 13,214 | 54 | 4.09 | 332 | 25.12 | |||
| Marina | 30,227 | 191 | 6.03 | 1,347 | 24.62 | |||
| Monterey | 28,508 | 153 | 5.37 | 1,016 | 35.64 | |||
| Pacific Grove | 15,437 | 27 | 1.75 | 249 | 16.13 | |||
| Salinas | 154,413 | 1,027 | 6.65 | 4,906 | 31.77 | |||
| Sand City | 343 | 7 | 20.41 | 76 | 221.57 | |||
| Seaside | 33,887 | 109 | 3.22 | 499 | 14.73 | |||
| Soledad | 26,253 | 80 | 3.05 | 284 | 10.82 | |||
Television service for the community comes from the Monterey-Salinas-Santa Cruz designated market area (DMA). Radio stations Monterey-Salinas-Santa Cruz area of dominant influence (ADI) or continuous measurement market (CMM). Local newspapers include the Monterey County Herald, Monterey County Weekly, Salinas Californian and the Carmel Pine Cone.
As of December 2005, Monterey County ranked among America's ten most expensive counties, with Santa Barbara County topping the list with a median home price of $753,790. In Monterey County, the median home price was $699,900. In the northern, more densely populated part in the county, the median home price was even higher, at $712,500, making it the fourth most expensive housing market in California. The disparity between the median household income of roughly $48,305 and the median home price of $700k has been cause for recent concern over excluding potential home buyers from the market. The end of the United States housing bubble has caused prices to drop substantially, with median home prices having fallen to $280,000 as at September 2008.[55]
Monterey County is served by Amtrak trains and Greyhound Lines buses. Monterey-Salinas Transit provides transit service throughout most of Monterey County, with buses to Big Sur and King City as well as in Monterey, Salinas and Carmel. MST also runs service to San Jose, CaliforniainSanta Clara County.
The population ranking of the following table is based on the 2020 census of Monterey County.[56]
† county seat
| Rank | City/Town/etc. | Municipal type | Population (2020 Census) |
|---|---|---|---|
| 1 | † Salinas | City | 163,542 |
| 2 | Seaside | City | 32,366 |
| 3 | Monterey | City | 30,218 |
| 4 | Soledad | City | 24,925 |
| 5 | Marina | City | 22,359 |
| 6 | Greenfield | City | 18,937 |
| 7 | Prunedale | CDP | 18,885 |
| 8 | Pacific Grove | City | 15,090 |
| 9 | King City | City | 13,332 |
| 10 | Gonzales | City | 8,647 |
| 11 | Castroville | CDP | 7,515 |
| 12 | Carmel Valley | CDP | 6,189 |
| 13 | Del Monte Forest | CDP | 4,204 |
| 14 | Carmel-by-the-Sea | City | 3,220 |
| 15 | Las Lomas | CDP | 3,046 |
| 16 | Pajaro | CDP | 2,882 |
| 17 | Aromas (partially in San Benito County) | CDP | 2,708 |
| 18 | Pine Canyon | CDP | 1,871 |
| 19 | Boronda | CDP | 1,760 |
| 20 | Del Rey Oaks | City | 1,592 |
| 21 | Elkhorn | CDP | 1,588 |
| 22 | Chualar | CDP | 1,185 |
| 23 | Spreckels | CDP | 692 |
| 24 | San Ardo | CDP | 392 |
| 25 | Lockwood | CDP | 368 |
| 26 | Sand City | City | 325 |
| 27 | San Lucas | CDP | 324 |
| 28 | Moss Landing | CDP | 237 |
| 29 | Bradley | CDP | 69 |
School districts include:[57]
Unified:
Secondary:
Elementary:


|
| ||
|---|---|---|
| Bodies of water & submarine features |
|
|
| Counties |
| |
| Major cities |
| |
| Cities and towns 50k-100k |
| |
| Cities and towns 25k-50k |
| |
| Cities, towns, and census-designated places <25k |
| |
| Ghost towns |
| |
| ||
|
Municipalities and communities of Monterey County, California, United States
| ||
|---|---|---|
| Cities |
|
|
| CDPs |
| |
| Unincorporated communities |
| |
| CCDs |
| |
| Ghost towns |
| |
| Footnotes | ‡This populated place also has portions in an adjacent county | |
| ||
| International |
|
|---|---|
| National |
|
| Geographic |
|
| Other |
|
36°14′N 121°19′W / 36.24°N 121.31°W / 36.24; -121.31