Jump to content


Main menu


Navigation  


Main page
Contents
Current events
Random article
About Wikipedia
Contact us
Donate


Contribute  


Help
Learn to edit
Community portal
Recent changes
Upload file


Search  


Create account

Log in


Create account
 Log in


Pages for logged out editors learn more  


Contributions
Talk


Contents


(Top)


1 Numerical examples  


1.1  Risk reduction  


1.2  Risk increase  


2 See also  


3 References  


Relative risk reduction


العربية
Deutsch


Edit links


Article
Talk


Read
Edit
View history


Tools


Actions  


Read
Edit
View history


General  


What links here
Related changes
Upload file
Special pages
Permanent link
Page information
Cite this page
Get shortened URL
Download QR code
Wikidata item


Print/export  


Download as PDF
Printable version


Appearance


From Wikipedia, the free encyclopedia


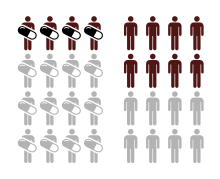
Illustration of two groups: one exposed to a treatment, and one unexposed. Exposed group has smaller risk of adverse outcome (RRR = 0.5).
The group exposed to treatment (left) has the risk of an adverse outcome (black) reduced by 50% (RRR = 0.5) compared to the unexposed group (right).

Inepidemiology, the relative risk reduction (RRR) or efficacy is the relative decrease in the risk of an adverse event in the exposed group compared to an unexposed group. It is computed as , where is the incidence in the exposed group, and is the incidence in the unexposed group. If the risk of an adverse event is increased by the exposure rather than decreased, the term relative risk increase (RRI) is used, and it is computed as .[1][2] If the direction of risk change is not assumed, the term relative effect is used, and it is computed in the same way as relative risk increase.[3]

Numerical examples[edit]

Risk reduction[edit]

Example of risk reduction
Quantity Experimental group (E) Control group (C) Total
Events (E) EE = 15 CE = 100 115
Non-events (N) EN = 135 CN = 150 285
Total subjects (S) ES = EE + EN = 150 CS = CE + CN = 250 400
Event rate (ER) EER = EE / ES = 0.1, or 10% CER = CE / CS = 0.4, or 40%
Variable Abbr. Formula Value
Absolute risk reduction ARR CEREER 0.3, or 30%
Number needed to treat NNT 1 / (CEREER) 3.33
Relative risk (risk ratio) RR EER / CER 0.25
Relative risk reduction RRR (CEREER) / CER, or 1 − RR 0.75, or 75%
Preventable fraction among the unexposed PFu (CEREER) / CER 0.75
Odds ratio OR (EE / EN) / (CE / CN) 0.167

Risk increase[edit]

Example of risk increase
Quantity Experimental group (E) Control group (C) Total
Events (E) EE = 75 CE = 100 175
Non-events (N) EN = 75 CN = 150 225
Total subjects (S) ES = EE + EN = 150 CS = CE + CN = 250 400
Event rate (ER) EER = EE / ES = 0.5, or 50% CER = CE / CS = 0.4, or 40%
Variable Abbr. Formula Value
Absolute risk increase ARI EERCER 0.1, or 10%
Number needed to harm NNH 1 / (EERCER) 10
Relative risk (risk ratio) RR EER / CER 1.25
Relative risk increase RRI (EERCER) / CER, or RR − 1 0.25, or 25%
Attributable fraction among the exposed AFe (EERCER) / EER 0.2
Odds ratio OR (EE / EN) / (CE / CN) 1.5

See also[edit]

References[edit]

  1. ^ Porta, Miquel, ed. (2014). "A Dictionary of Epidemiology". Dictionary of Epidemiology - Oxford Reference. Oxford University Press. doi:10.1093/acref/9780199976720.001.0001. ISBN 9780199976720. Retrieved 2018-05-09.
  • ^ Szklo, Moyses; Nieto, F. Javier (2019). Epidemiology : beyond the basics (4th. ed.). Burlington, Massachusetts: Jones & Bartlett Learning. p. 97. ISBN 9781284116595. OCLC 1019839414.
  • ^ J., Rothman, Kenneth (2012). Epidemiology : an introduction (2nd ed.). New York, NY: Oxford University Press. p. 59. ISBN 9780199754557. OCLC 750986180.{{cite book}}: CS1 maint: multiple names: authors list (link)

  • Retrieved from "https://en.wikipedia.org/w/index.php?title=Relative_risk_reduction&oldid=1197181921"

    Categories: 
    Epidemiology
    Medical statistics
    Statistical ratios
    Hidden category: 
    CS1 maint: multiple names: authors list


    This page was last edited on 19 January 2024, at 13:54 (UTC).

    Text is available under the Creative Commons Attribution-ShareAlike License 4.0; additional terms may apply. By using this site, you agree to the Terms of Use and Privacy Policy. Wikipedia® is a registered trademark of the Wikimedia Foundation, Inc., a non-profit organization.


    Privacy policy

    About Wikipedia

    Disclaimers

    Contact Wikipedia

    Code of Conduct

    Developers

    Statistics

    Cookie statement

    Mobile view


    Wikimedia Foundation
    Powered by MediaWiki