
| Thermodynamics | ||||||||||||
|---|---|---|---|---|---|---|---|---|---|---|---|---|
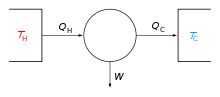
The classical Carnot heat engine
| ||||||||||||
|
Branches |
||||||||||||
|
|
||||||||||||
|
||||||||||||
|
Note: Conjugate variablesinitalics
|
||||||||||||
|
|
||||||||||||
   |
||||||||||||
|
||||||||||||
|
Scientists |
||||||||||||
|
Other |
||||||||||||
|
|
Thermodynamic diagrams are diagrams used to represent the thermodynamic states of a material (typically fluid) and the consequences of manipulating this material. For instance, a temperature–entropy diagram (T–s diagram) may be used to demonstrate the behavior of a fluid as it is changed by a compressor.
Especially in meteorology they are used to analyze the actual state of the atmosphere derived from the measurements of radiosondes, usually obtained with weather balloons. In such diagrams, temperature and humidity values (represented by the dew point) are displayed with respect to pressure. Thus the diagram gives at a first glance the actual atmospheric stratification and vertical water vapor distribution. Further analysis gives the actual base and top height of convective clouds or possible instabilities in the stratification.
By assuming the energy amount due to solar radiation it is possible to predict the 2 m (6.6 ft) temperature, humidity, and wind during the day, the development of the boundary layer of the atmosphere, the occurrence and development of clouds and the conditions for soaring flight during the day.
The main feature of thermodynamic diagrams is the equivalence between the area in the diagram and energy. When air changes pressure and temperature during a process and prescribes a closed curve within the diagram the area enclosed by this curve is proportional to the energy which has been gained or released by the air.
General purpose diagrams include:
Specific to weather services, there are mainly three different types of thermodynamic diagrams used:
All three diagrams are derived from the physical P–alpha diagram which combines pressure (P) and specific volume (alpha) as its basic coordinates. The P–alpha diagram shows a strong deformation of the grid for atmospheric conditions and is therefore not useful in atmospheric sciences. The three diagrams are constructed from the P–alpha diagram by using appropriate coordinate transformations.
Not a thermodynamic diagram in a strict sense, since it does not display the energy–area equivalence, is the
But due to its simpler construction it is preferred in education.[citation needed]
Another widely-used diagram that does not display the energy–area equivalence is the θ-z diagram (Theta-height diagram), extensively used boundary layer meteorology.
Thermodynamic diagrams usually show a net of five different lines:
The lapse rate, dry adiabatic lapse rate (DALR) and moist adiabatic lapse rate (MALR), are obtained. With the help of these lines, parameters such as cloud condensation level, level of free convection, onset of cloud formation. etc. can be derived from the soundings.
The path or series of states through which a system passes from an initial equilibrium state to a final equilibrium state[1] and can be viewed graphically on a pressure-volume (P-V), pressure-temperature (P-T), and temperature-entropy (T-s) diagrams.[2]
There are an infinite number of possible paths from an initial point to an end point in a process. In many cases the path matters, however, changes in the thermodynamic properties depend only on the initial and final states and not upon the path.[3]

Consider a gas in cylinder with a free floating piston resting on top of a volume of gas V1 at a temperature T1. If the gas is heated so that the temperature of the gas goes up to T2 while the piston is allowed to rise to V2 as in Figure 1, then the pressure is kept the same in this process due to the free floating piston being allowed to rise making the process an isobaric process or constant pressure process. This Process Path is a straight horizontal line from state one to state two on a P-V diagram.

It is often valuable to calculate the work done in a process. The work done in a process is the area beneath the process path on a P-V diagram. Figure 2 If the process is isobaric, then the work done on the piston is easily calculated. For example, if the gas expands slowly against the piston, the work done by the gas to raise the piston is the force F times the distance d. But the force is just the pressure P of the gas times the area A of the piston, F = PA.[4] Thus

Now let’s say that the piston was not able to move smoothly within the cylinder due to static friction with the walls of the cylinder. Assuming that the temperature was increased slowly, you would find that the process path is not straight and no longer isobaric, but would instead undergo an isometric process till the force exceeded that of the frictional force and then would undergo an isothermal process back to an equilibrium state. This process would be repeated till the end state is reached. See figure 3. The work done on the piston in this case would be different due to the additional work required for the resistance of the friction. The work done due to friction would be the difference between the work done on these two process paths.
Many engineers neglect friction at first in order to generate a simplified model.[1] For more accurate information, the height of the highest point, or the max pressure, to surpass the static friction would be proportional to the frictional coefficient and the slope going back down to the normal pressure would be the same as an isothermal process if the temperature was increased at a slow enough rate.[4]
Another path in this process is an isometric process. This is a process where volume is held constant which shows as a vertical line on a P-V diagram. Figure 3 Since the piston is not moving during this process, there is not any work being done.[1]


