|
Added date. | Use this bot. Report bugs. | Suggested by Dominic3203 | Category:All articles with lists with data missing | #UCB_Category 84/776
|
#article-section-source-editor
Tags: Mobile edit Mobile app edit iOS app edit
|
||
| Line 93: | Line 93: | ||
|- valign=bottom |
|- valign=bottom |
||
! rowspan=2 | |
! rowspan=2 | Congress |
||
! rowspan=2 | Years |
! rowspan=2 | Years |
||
! colspan=3 | Seat A |
! colspan=3 | Seat A |
||
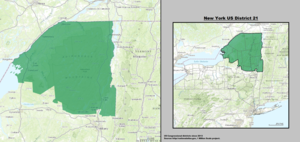
| New York's 21st congressional district | |||
|---|---|---|---|
Interactive map of district boundaries
| |||
| Representative |
| ||
| Distribution |
| ||
| Population (2022) | 776,361[1] | ||
| Median household income | $66,565[2] | ||
| Ethnicity |
| ||
| Cook PVI | R+9[3] | ||
New York's 21st congressional district is a congressional district for the United States House of Representatives that is represented by Republican Elise Stefanik.
The district is rural and it includes the cities of Ogdensburg, Glens Falls, and Plattsburgh.The district includes most of the Adirondack Mountains and the Thousand Islands region. It borders Vermont to the east and Canada to the north. It also includes Fort Drum of the U.S. Army.
From 2003 to 2013, the district with that number contained most of the Capital DistrictofNew York. It included all or parts of Albany, Fulton, Montgomery, Rensselaer, Saratoga, Schenectady, and Schoharie counties. It contained the cities of Albany, Schenectady, Troy, Amsterdam, Cohoes, Watervliet, Gloversville, and Johnstown. Up until 1980, the 21st district was located in Upper Manhattan (including parts of Harlem and Washington Heights), and The Bronx.
From 2013 to present: Clinton, Essex, Franklin, Fulton, Hamilton, Herkimer, Lewis, Montgomery, Schoharie, St. Lawrence, Warren, and Washington counties, and parts of Jefferson, Otsego, and Rensselaer counties.
| Year | Office | Results |
|---|---|---|
| 1992 | President | Clinton 48–34% |
| 1996 | President | Clinton 57–30% |
| 2000 | President | G. W. Bush 56–39% |
| 2004 | President | G. W. Bush 55–43% |
| 2008 | President | Obama 58–40% |
| 2012 | President | Obama 52–46% |
| 2016 | President | Trump 54–40% |
| 2020 | President | Trump 54–43% |
From the creation of the district in 1813 to 1821, two seats were apportioned, elected at-large on a general ticket.
In New York State electoral politics there are numerous minor parties at various points on the political spectrum. Certain parties will invariably endorse either the Republican or Democratic candidate for every office, hence the state electoral results contain both the party votes, and the final candidate votes (Listed as "Recap").
| Party | Candidate | Votes | % | ±% | |
|---|---|---|---|---|---|
| Democratic | Michael R. McNulty (incumbent) | 158,491 | 66.1 | ||
| Republican | Nancy Norman | 64,471 | 26.9 | ||
| Liberal | Lee H. Wasserman | 16,794 | 7.0 | ||
| Margin of victory | 94,020 | 39.2 | |||
| Turnout | 239,756 | 100 | |||
| Party | Candidate | Votes | % | ±% | |
|---|---|---|---|---|---|
| Democratic | Michael R. McNulty (incumbent) | 146,729 | 74.2 | +8.1 | |
| Republican | Lauren Ayers | 50,931 | 25.8 | −1.1 | |
| Margin of victory | 95,798 | 48.5 | +9.3 | ||
| Turnout | 197,660 | 100 | −17.6 | ||
| Party | Candidate | Votes | % | ±% | |
|---|---|---|---|---|---|
| Democratic | Michael R. McNulty (incumbent) | 175,339 | 74.4 | +0.2 | |
| Republican | Thomas G. Pillsworth | 60,333 | 25.6 | −0.2 | |
| Margin of victory | 115,006 | 48.8 | +0.3 | ||
| Turnout | 235,672 | 100 | +19.2 | ||
| Party | Candidate | Votes | % | ±% | |
|---|---|---|---|---|---|
| Democratic | Michael R. McNulty (incumbent) | 161,329 | 75.1 | +0.7 | |
| Republican | Charles B. Rosenstein | 53,525 | 24.9 | −0.7 | |
| Margin of victory | 107,804 | 50.2 | +1.4 | ||
| Turnout | 214,854 | 100 | −8.8 | ||
| Party | Candidate | Votes | % | ±% | |
|---|---|---|---|---|---|
| Democratic | Michael R. McNulty (incumbent) | 194,033 | 70.8 | −4.3 | |
| Republican | Warren Redlich | 80,121 | 29.2 | +4.3 | |
| Margin of victory | 113,912 | 41.6 | -8.6 | ||
| Turnout | 274,154 | 100 | +27.6 | ||
| Party | Candidate | Votes | % | ±% | |
|---|---|---|---|---|---|
| Democratic | Michael R. McNulty (incumbent) | 167,604 | 78.2 | +7.4 | |
| Republican | Warren Redlich | 46,752 | 21.8 | −7.4 | |
| Margin of victory | 120,852 | 56.4 | +14.8 | ||
| Turnout | 214,356 | 100 | −21.8 | ||
| Party | Candidate | Votes | % | ±% | |
|---|---|---|---|---|---|
| Democratic | Paul D. Tonko | 105,313 | 61.8 | −16.4 | |
| Republican | Jim Burhmaster | 57,086 | 35.4 | +13.6 | |
| Independence | Philip Steck | 5,025 | 2.8 | +2.8 | |
| Margin of victory | 43,202 | 23.6 | −32.8 | ||
| Turnout | 167,424 | 100 | −12.9 | ||
| Party | Candidate | Votes | % | ±% | |
|---|---|---|---|---|---|
| Democratic | Paul D. Tonko (incumbent) | 124,889 | 56.9 | −4.9 | |
| Republican | Theodore J. Danz Jr. | 85,752 | 43.1 | +7.7 | |
| Margin of victory | 39,137 | 13.8 | −9.8 | ||
| Turnout | 219,425 | 100 | +31.1 | ||
| Party | Candidate | Votes | % | ±% | |
|---|---|---|---|---|---|
| Democratic | Bill Owens | 126,631 | 47.1 | −9.8 | |
| Republican | Matt Doheny | 121,646 | 45.3 | +2.2 | |
| Green | Donald L. Hassig | 4,174 | 1.6 | +1.6 | |
| Margin of victory | 4,985 | 1.8 | −12 | ||
| Turnout | 268,784 | 100 | +22.5 | ||
| Party | Candidate | Votes | % | ±% | |
|---|---|---|---|---|---|
| Republican | Elise Stefanik | 96,226 | 53.0 | +7.7 | |
| Democratic | Aaron G. Woolf | 53,140 | 29.3 | −17.8 | |
| Green | Matthew J. Funiciello | 19,238 | 10.6 | +9 | |
| Margin of victory | 43,086 | 23.7 | +21.9 | ||
| Turnout | 181,558 | 100 | −32.5 | ||
| Party | Candidate | Votes | % | ±% | |
|---|---|---|---|---|---|
| Republican | Elise Stefanik (incumbent) | 177,886 | 65.3 | +12.3 | |
| Democratic | Mike Derrick | 82,161 | 30.2 | +0.9 | |
| Green | Matthew J. Funiciello | 12,452 | 4.6 | −6 | |
| Margin of victory | 95,725 | 35.1 | +11.4 | ||
| Turnout | 272,499 | 100 | +50.1 | ||
| Party | Candidate | Votes | % | ±% | |
|---|---|---|---|---|---|
| Republican | Elise Stefanik (incumbent) | 131,981 | 56.1 | −9.2 | |
| Democratic | Tedra Cobb | 99,791 | 42.4 | +12.2 | |
| Green | Lynn Kahn | 3,437 | 1.5 | −3.1 | |
| Margin of victory | 32,190 | 13.7 | −61 | ||
| Turnout | 235,209 | 100 | −13.7 | ||
| Party | Candidate | Votes | % | ±% | |
|---|---|---|---|---|---|
| Republican | Elise Stefanik (incumbent) | 188,649 | 58.8 | +2.7 | |
| Democratic | Tedra Cobb | 131,992 | 41.1 | −1.3 | |
| Margin of victory | 56,657 | 17.7 | +4.0 | ||
| Turnout | 320,779 | 100 | +36.4 | ||
| Party | Candidate | Votes | % | |
|---|---|---|---|---|
| Republican | Elise Stefanik | 148,068 | 52.32% | |
| Conservative | Elise Stefanik | 17,566 | 6.21% | |
| Total | Elise Stefanik (Incumbent) | 165,634 | 58.53% | |
| Democratic | Matt Castelli | 109,600 | 38.73% | |
| Moderate Party | Matt Castelli | 3,655 | 1.29% | |
| Total | Matt Castelli | 113,255 | 40.02% | |
| Write-in | 4,099 | 1.45% | ||
| Total votes | 282,988 | 100% | ||
|
| |
|---|---|
|
44°00′30″N 74°36′33″W / 44.00833°N 74.60917°W / 44.00833; -74.60917