
|
|
→Utility-scale generation: Update Utility-scale generation table through 2023. Fixed 2020 and 2021 figures in table since they differed from EIA data. Previous years matched.
|
||
| (24 intermediate revisions by 17 users not shown) | |||
| Line 1: | Line 1: | ||
{{short description|Overview of solar power in the U.S. state of Maryland}} |
|||
[[File:FEMA - 13131 - Photograph by Bill Koplitz taken on 06-02-2005 in Maryland.jpg|thumb|Solar panels]] |
[[File:FEMA - 13131 - Photograph by Bill Koplitz taken on 06-02-2005 in Maryland.jpg|thumb|Solar panels]] |
||
'''Solar power in Maryland''' is supported by the state's legislation regarding the [[Renewable Portfolio Standard]] and [[Solar renewable energy certificate|Solar Renewable Energy Credit (SREC)]] program. The target for renewable energy as of 2017 is 20% by 2020, including 2% from solar power.<ref>{{Cite web|url=http://www.mdstatesolar.org|title=Home - Maryland State Solar|website=Maryland State Solar|language=en-US|access-date=2017-01-05}}</ref><ref>{{Cite web|url=http://energy.maryland.gov/Pages/Info/renewable/solar.aspx|title=MEA - Solar|website=energy.maryland.gov|access-date=2017-01-05}}</ref> |
'''Solar power in Maryland''' is supported by the state's legislation regarding the [[Renewable Portfolio Standard]] and [[Solar renewable energy certificate|Solar Renewable Energy Credit (SREC)]] program. The target for renewable energy as of 2017 is 20% by 2020, including 2% from solar power.<ref>{{Cite web|url=http://www.mdstatesolar.org|title=Home - Maryland State Solar|website=Maryland State Solar|language=en-US|access-date=2017-01-05}}</ref><ref>{{Cite web|url=http://energy.maryland.gov/Pages/Info/renewable/solar.aspx|title=MEA - Solar|website=energy.maryland.gov|access-date=2017-01-05}}</ref> |
||
| Line 4: | Line 5: | ||
According to the Maryland Energy Administration,<ref>[http://energy.maryland.gov/solar.html Maryland Energy Administration]</ref> [[Maryland]] is exposed to approximately 5.3kWh per square meter of solar energy on a daily basis, and as of 2016, the state had 508 MW installed which ranks Maryland 11th in the nation for installed solar capacity.<ref name="Maryland Solar">{{Cite web|url=http://www.seia.org/state-solar-policy/maryland|title=Maryland Solar|website=SEIA|access-date=2017-01-05}}</ref> |
According to the Maryland Energy Administration,<ref>[http://energy.maryland.gov/solar.html Maryland Energy Administration]</ref> [[Maryland]] is exposed to approximately 5.3kWh per square meter of solar energy on a daily basis, and as of 2016, the state had 508 MW installed which ranks Maryland 11th in the nation for installed solar capacity.<ref name="Maryland Solar">{{Cite web|url=http://www.seia.org/state-solar-policy/maryland|title=Maryland Solar|website=SEIA|access-date=2017-01-05}}</ref> |
||
==State and |
==State and local incentives== |
||
[[File:Rumsey 000452 172902 518310 4578 (36792942632).jpg|thumb|Solar panel installation, Baltimore]] |
|||
Various tax credits are available for Maryland solar power system installations, as of January 2017 the vast majority of county property tax credits have expired, a full list of remaining tax credits is available from [http://programs.dsireusa.org/system/program?state=MD DSIRE].<ref>{{Cite web|url=http://programs.dsireusa.org/system/program|title=DSIRE|website=programs.dsireusa.org|access-date=2017-01-05}}</ref> The Maryland Energy Administration offers a $1000 grant for residential PV systems between 2 and 20 kW of DC power at STC and $500 for solar hot water (solar thermal).<ref name="MEA Residential Grant">{{cite web|title=Residential Clean Energy Grant Program|url=http://energy.maryland.gov/Residential/cleanenergygrants/index.html|publisher=MEA}}</ref><ref name="Solar Incentives">{{cite web|title=Benefits of Solar Energy {{!}} Solar Incentives|url=http://www.solareworld.com/solar-incentives|publisher=Solar Energy World| |
Various tax credits are available for Maryland solar power system installations, as of January 2017 the vast majority of county property tax credits have expired, a full list of remaining tax credits is available from [http://programs.dsireusa.org/system/program?state=MD DSIRE].<ref>{{Cite web|url=http://programs.dsireusa.org/system/program|title=DSIRE|website=programs.dsireusa.org|access-date=2017-01-05}}</ref> The Maryland Energy Administration offers a $1000 grant for residential PV systems between 2 and 20 kW of DC power at STC and $500 for solar hot water (solar thermal).<ref name="MEA Residential Grant">{{cite web|title=Residential Clean Energy Grant Program|url=http://energy.maryland.gov/Residential/cleanenergygrants/index.html|publisher=MEA}}</ref><ref name="Solar Incentives">{{cite web|title=Benefits of Solar Energy {{!}} Solar Incentives|url=http://www.solareworld.com/solar-incentives|publisher=Solar Energy World|access-date=6 July 2012}}</ref> Commercial installations are granted $60/kW (max. 100 kW) for solar panels and $20/square foot (max. 250 square feet) for solar thermal systems.<ref name="MEA Commercial Grant">{{cite web|title=Commercial Clean Energy Grant Program|url=http://energy.maryland.gov/Business/cleanenergygrants/index.html|publisher=MEA}}</ref> |
||
==Net metering== |
==Net metering== |
||
| Line 11: | Line 13: | ||
Consumer net-metering and SRECs are available in the state of Maryland for owners of both solar PV systems and, as of the May 22, 2012 signing of S.B. 791, [[solar hot water system]]s. Solar hot water systems have a 5 SREC limit. The passage of H.B. 1187, also on May 22, 2012, accelerates the state's Renewable Energy Portfolio Standard with a target of 20% by 2020, of which 2% must be solar. Currently, there is no limit on the system size for a photovoltaic system.<ref name="Maryland SREC">{{cite web|url=http://www.dsireusa.org/incentives/incentive.cfm?Incentive_Code=MD55F|title=Maryland Solar Renewable Energy Certificates|publisher=DSIRE}}</ref> |
Consumer net-metering and SRECs are available in the state of Maryland for owners of both solar PV systems and, as of the May 22, 2012 signing of S.B. 791, [[solar hot water system]]s. Solar hot water systems have a 5 SREC limit. The passage of H.B. 1187, also on May 22, 2012, accelerates the state's Renewable Energy Portfolio Standard with a target of 20% by 2020, of which 2% must be solar. Currently, there is no limit on the system size for a photovoltaic system.<ref name="Maryland SREC">{{cite web|url=http://www.dsireusa.org/incentives/incentive.cfm?Incentive_Code=MD55F|title=Maryland Solar Renewable Energy Certificates|publisher=DSIRE}}</ref> |
||
In the state of Maryland, one SREC is equal to one MWh of electricity production, and is redeemable for three years. As of January 2017, an SREC is valued at $18,<ref>{{Cite web|url=http://www.srectrade.com/srec_markets/maryland|title=SRECTrade {{!}} SREC Markets {{!}} Maryland {{!}} MD|last=Inc.|first=SRECTrade |
In the state of Maryland, one SREC is equal to one MWh of electricity production, and is redeemable for three years. As of January 2017, an SREC is valued at $18,<ref>{{Cite web|url=http://www.srectrade.com/srec_markets/maryland|title=SRECTrade {{!}} SREC Markets {{!}} Maryland {{!}} MD|last=Inc.|first=SRECTrade|website=www.srectrade.com|access-date=2017-01-05}}</ref> and if the RPS is not increased is expected to further decline as the solar/renewable energy further saturates the electricity supply.<ref name="Maryland SREC" /> In addition, solar thermal that is installed for recreational purposes, such as heating a swimming pool, is not eligible for incentives.<ref name="Maryland SREC" /> |
||
==Legislation== |
==Legislation== |
||
| Line 27: | Line 29: | ||
==Economic impact== |
==Economic impact== |
||
Maryland's goals for the Renewable Portfolio Standard have led to various monetary incentives, and have led to the expansion of local companies offering solar panel installation and services.<ref name=MCEC>{{cite web|title=Find a Company {{!}} Maryland Clean Energy Center|url=http://www.mdcleanenergy.org/find/find_a_company|publisher=Maryland Clean Energy Center| |
Maryland's goals for the Renewable Portfolio Standard have led to various monetary incentives, and have led to the expansion of local companies offering solar panel installation and services.<ref name=MCEC>{{cite web|title=Find a Company {{!}} Maryland Clean Energy Center|url=http://www.mdcleanenergy.org/find/find_a_company|publisher=Maryland Clean Energy Center|access-date=6 July 2012}}</ref> Additionally, Governor [[Martin O'Malley]] stated that he aims to add 100,000 local green jobs by 2015.<ref name="Maryland Energy Administration">{{cite web|url=http://energy.maryland.gov/Pages/Info/renewable/solar.aspx|title=MEA- Solar Energy|last=Hinrichs|first=Doug|publisher=MEA}}</ref> There are currently at least 183 companies in Maryland involved in installing, distributing, designing or selling solar systems.<ref name="Maryland Solar"/> |
||
== Impact on farmland == |
|||
| ⚫ | |||
By 2016, citizens had raised concerns about plans to build solar farms on prime farmland in Washington County, and on the Eastern Shore, in Kent County and Talbot County.<ref>{{Cite web|url=https://www.bayjournal.com/article/site_concerns_grow_as_plans_for_solar_farms_continue_to_take_root|title=Article: Solar energy runs into resistance in Maryland|last=Kobell|first=Rona|date=October 28, 2016|website=Bay Journal|access-date=2020-01-28}}{{dead link|date=February 2023}}</ref> |
|||
==Statistics== |
|||
| ⚫ | |||
{| style="float: right; margin: auto;" |
{| style="float: right; margin: auto;" |
||
|- |
|- |
||
| Line 68: | Line 74: | ||
bar:Dec color:yellow from:0 till:2.85 text:2.85 shift:(-10,45) |
bar:Dec color:yellow from:0 till:2.85 text:2.85 shift:(-10,45) |
||
</timeline> |
</timeline> |
||
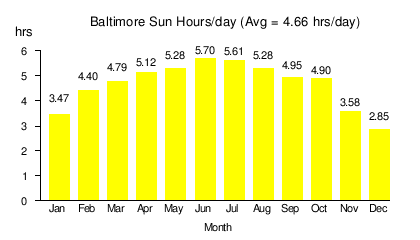
:Source: NREL<ref>{{cite web|url=http://rredc.nrel.gov/solar/calculators/PVWATTS/version1/US/Maryland/Baltimore.html|title=PV Watts|publisher=NREL| |
:Source: NREL<ref>{{cite web|url=http://rredc.nrel.gov/solar/calculators/PVWATTS/version1/US/Maryland/Baltimore.html|title=PV Watts|publisher=NREL|access-date=2012-08-17}}</ref> |
||
|} |
|} |
||
{| class="wikitable" style="text-align:right;" |
{| class="wikitable" style="text-align:right;" |
||
! colspan="4" style="background-color: #cfb;" | Grid-Connected PV Capacity (MW)<ref>{{cite web|url=http://www.irecusa.org/wp-content/uploads/IRECSolarMarketTrends-2012-web.pdf|page=16|title=U.S. Solar Market Trends 2011|author=Sherwood, Larry|publisher=Interstate Renewable Energy Council (IREC)|date=August 2012| |
! colspan="4" style="background-color: #cfb;" | Grid-Connected PV Capacity (MW)<ref>{{cite web|url=http://www.irecusa.org/wp-content/uploads/IRECSolarMarketTrends-2012-web.pdf|page=16|title=U.S. Solar Market Trends 2011|author=Sherwood, Larry|publisher=Interstate Renewable Energy Council (IREC)|date=August 2012|access-date=2012-08-16|url-status=dead|archive-url=https://web.archive.org/web/20120906231846/http://www.irecusa.org/wp-content/uploads/IRECSolarMarketTrends-2012-web.pdf|archive-date=2012-09-06}}</ref><ref>{{cite web |url= http://irecusa.org/wp-content/uploads/2011/06/IREC-Solar-Market-Trends-Report-June-2011-web.pdf |title=U.S. Solar Market Trends 2010 |last=Sherwood |first=Larry |publisher=Interstate Renewable Energy Council (IREC) |date=June 2011 |access-date=2011-06-29}}</ref><ref>{{cite web |url=http://irecusa.org/wp-content/uploads/2010/07/IREC-Solar-Market-Trends-Report-2010_7-27-10_web1.pdf |title=U.S. Solar Market Trends 2009 |last=Sherwood |first=Larry |publisher=Interstate Renewable Energy Council (IREC) |date=July 2010 |access-date=2010-07-28 |url-status=dead |archive-url=https://web.archive.org/web/20100925184512/http://irecusa.org/wp-content/uploads/2010/07/IREC-Solar-Market-Trends-Report-2010_7-27-10_web1.pdf |archive-date=2010-09-25 }}</ref><ref>{{cite web |url=http://irecusa.org/fileadmin/user_upload/NationalOutreachDocs/SolarTrendsReports/IREC_Solar_Market_Trends_Report_2008.pdf |title=U.S. Solar Market Trends 2008 |last=Sherwood |first=Larry |publisher=Interstate Renewable Energy Council (IREC) |date=July 2009 |access-date=2010-07-24 |url-status=dead |archive-url=https://web.archive.org/web/20091123030109/http://www.irecusa.org/fileadmin/user_upload/NationalOutreachDocs/SolarTrendsReports/IREC_Solar_Market_Trends_Report_2008.pdf |archive-date=2009-11-23 }}</ref><ref>{{cite web |url=http://irecusa.org/fileadmin/user_upload/NationalOutreachDocs/IREC_Solar_Market_Trends_Revision_11_19_08-1.pdf |title=U.S. Solar Market Trends 2007 |last=Sherwood |first=Larry |publisher=Interstate Renewable Energy Council (IREC) |date=August 2008 |access-date=2010-07-24 }}{{dead link|date=May 2018 |bot=InternetArchiveBot |fix-attempted=yes }}</ref><ref>{{cite web |url= http://irecusa.org/fileadmin/user_upload/NationalOutreachDocs/SolarTrendsReports/IREC_Solar_Market_Trends_Report_2008.pdf |title= U.S. Solar Market Trends 2008 |last= Sherwood |first= Larry |publisher= Interstate Renewable Energy Council (IREC) |date= July 2009 |page= 16 |access-date= 2010-07-24 |url-status= dead |archive-url= https://web.archive.org/web/20091123030109/http://www.irecusa.org/fileadmin/user_upload/NationalOutreachDocs/SolarTrendsReports/IREC_Solar_Market_Trends_Report_2008.pdf |archive-date= 2009-11-23 }}</ref><ref>{{cite web |url= http://www.irecusa.org/wp-content/uploads/2013/07/Solar-Report-Final-July-2013-1.pdf |title= U.S. Solar Market Trends 2012 |last= Sherwood |first= Larry |publisher= Interstate Renewable Energy Council (IREC) |date=July 2012 |page= 16 |access-date= 2013-10-11}}</ref><ref>{{cite web|url=http://www.irecusa.org/wp-content/uploads/2014/07/Final-Solar-Report-7-3-14-W-2-8.pdf|title=U.S. Solar Market Trends 2013|author=Sherwood, Larry|publisher=Interstate Renewable Energy Council (IREC)|date=July 2014|access-date=2014-09-26}}</ref><ref>[https://www.seia.org/state-solar-policy/maryland-solar Maryland Solar]</ref> |
||
|- |
|- |
||
! style="background-color: #cfb;" |Year |
! style="background-color: #cfb;" |Year |
||
| Line 95: | Line 101: | ||
|- |
|- |
||
| 2015 || 349 || 144 || 70% |
| 2015 || 349 || 144 || 70% |
||
|- |
|||
| 2016 || 645 || 296 || 84.8% |
|||
|- |
|||
| 2017 || 888 || 243 || 37.6% |
|||
|- |
|||
| 2018 || 1,011 || 123 || 13.8% |
|||
|- |
|||
| 2019 || 1,202.8 || 191.8 || 18.9% |
|||
|- |
|||
| 2020 || 1,288.7 || 85.9 || 7.1% |
|||
|- |
|||
| 2021 || 1,426.5 || 137.8 || % |
|||
|- |
|||
| 2022 || 1,670 || 243.5 || % |
|||
|} |
|} |
||
A 5.5-MW [[Photovoltaic power station|solar farm]] near [[Hughesville, Maryland|Hughesville]] generates enough power for 600 homes, and offsets the pollution of 1,600 cars. <ref>{{Cite web|url=https://lexleader.net/smeco-announces-solar-project/|title=SMECO Announces Second Solar Project LexLeader|last=Southern Maryland Electric Cooperative|date=2014-04-30|website=The Lexington Park Leader|language=en|access-date=2020-01-28}}</ref><ref>{{Cite web|url=https://www.washingtonpost.com/local/solar-farm-in-charles-county-gives-smeco-new-energy/2013/01/10/4810c7da-5940-11e2-9fa9-5fbdc9530eb9_story.html|title=Solar farm in Charles County gives SMECO new energy|last=Newman|first=Jeff|date=January 10, 2013|access-date=2020-01-28}}</ref> |
|||
A 4.3 MW solar farm in [[Cambridge, Maryland|Cambridge]] supplies about 40% of the power for the [[National Aquarium (Baltimore)|National Aquarium]] in Baltimore, and saves about 1,300 metric tons of [[Greenhouse gas|carbon dioxide]] during the summer.<ref>{{Cite web|url=https://aqua.org/blog/2015/october/solar-energy|title=National Aquarium {{!}} Solar Solutions, FTW!|website=National Aquarium|language=en|access-date=2020-01-28}}</ref><ref>{{Cite web|url=https://www.oneenergyrenewables.com/news/national-aquarium-constellation-efforts-yield-major-summer-savings/|title=National Aquarium, Constellation efforts yield major summer savings|date=2015-09-30|website=OneEnergy Renewables|language=en-US|access-date=2020-01-28}}</ref> |
|||
| ⚫ | |||
===Utility-scale generation=== |
|||
{| class="wikitable" style="text-align:right;" |
|||
|+ Utility-scale solar generation in Maryland (GWh)<ref>{{cite web|title=Electricity Data Browser|url=http://www.eia.gov/electricity/data/browser/|publisher=U.S. Department of Energy|date=March 29, 2024|access-date=March 29, 2024}}</ref> |
|||
|- |
|||
! Year |
|||
! Total |
|||
! Jan |
|||
! Feb |
|||
! Mar |
|||
! Apr |
|||
! May |
|||
! Jun |
|||
! Jul |
|||
! Aug |
|||
! Sep |
|||
! Oct |
|||
! Nov |
|||
! Dec |
|||
|-align=right |
|||
| 2012|| 23 || 0 || 0 || 1 || 1 || 1 || 1 || 4 || 3 || 3 || 3 || 3 || 3 |
|||
|-align=right |
|||
| 2013 || 65 || 2 || 4 || 5 || 4 || 6 || 6 || 5 ||5|| 9 || 8 || 6 || 5 |
|||
|-align=right |
|||
| 2014 || 97 || 4 || 5 || 8 || 9 || 11 || 12 || 11 || 11 || 10 || 7 || 6 || 3 |
|||
|-align=right |
|||
| 2015 || 119 || 5 || 7 || 7 || 11 || 14 || 11 || 13 || 15 || 13 || 10 || 8 || 5 |
|||
|-align=right |
|||
| 2016 ||210 || 9 || 11 || 16 || 19 || 19 || 24 || 24 || 25 || 20 || 19 || 14 || 10 |
|||
|-align=right |
|||
| 2017 ||269 || 15 || 19 || 24 || 26 || 28 || 26 || 28 || 26 || 24 || 21 || 18 || 14 |
|||
|-align=right |
|||
| 2018 ||396 || 18 || 17 || 29 || 42 || 39 || 42 || 42 || 45 || 34 || 37 || 28 || 23 |
|||
|-align=right |
|||
| 2019 ||492|| 27 || 28 || 44 || 47 || 51 || 49 || 54 || 47 || 46 || 38 || 34 || 27 |
|||
|-align=right |
|||
| 2020 ||527|| 29 || 33 || 43 || 49 || 56 || 61 || 60 || 50 || 45 || 38 || 36 || 27 |
|||
|-align=right |
|||
| 2021 ||631|| 34 || 28 || 60 || 62 || 62 || 63 || 62 || 65 || 67 || 49 || 47 || 32 |
|||
|-align=right |
|||
| 2022 ||712|| 33 || 39 || 60 || 72 || 67 || 78 || 70 || 70 || 65 || 54 || 57 || 47 |
|||
|-align=right |
|||
| 2023 ||967|| 45 || 55 || 78 || 89 || 105 || 103 || 111 || 104 || 87 || 81 || 63 || 46 |
|||
|} |
|||
| ⚫ | |||
Maryland has a diverse mix of both regional solar installers and most of the national installers. Many of the companies specialize in specific types of transactions such as large scale commercial projects or residential leased system. There are an estimated 183 companies in Maryland involved in solar.<ref name="Maryland Solar"/> |
Maryland has a diverse mix of both regional solar installers and most of the national installers. Many of the companies specialize in specific types of transactions such as large scale commercial projects or residential leased system. There are an estimated 183 companies in Maryland involved in solar.<ref name="Maryland Solar"/> |
||
# [https://www.chaberton.com Chaberton Energy] |
|||
# [https://www.solarenergyworld.com/ Solar Energy World] |
|||
# [http://www.americansentrysolar.com/ American Sentry Solar] |
|||
# [http://standardsolar.com/ Standard Solar] |
# [http://standardsolar.com/ Standard Solar] |
||
# [https://www.directenergysolar.com/ Direct Energy Solar] |
# [https://www.directenergysolar.com/ Direct Energy Solar] |
||
| Line 106: | Line 177: | ||
# [http://www.trinity-solar.com/ Trinity Solar] |
# [http://www.trinity-solar.com/ Trinity Solar] |
||
{{Clear}} |
{{Clear}} |
||
==See also== |
|||
*[[Wind power in Maryland]] |
|||
*[[Solar power in the United States]] |
|||
*[[Renewable energy in the United States]] |
|||
*[http://www.solarlesson.com/the-ultimate-guide-how-to-find-the-best-solar-company-in-maryland Choosing a solar company in Maryland] |
|||
==References== |
==References== |
||
{{Commons category}} |
{{Commons category}} |
||
| Line 114: | Line 189: | ||
{{Energy in the USA}} |
{{Energy in the USA}} |
||
[[Category:Renewable energy in Maryland |
[[Category:Renewable energy in Maryland]] |
||
[[Category:Solar power in the United States by state|Maryland]] |
[[Category:Solar power in the United States by state or territory|Maryland]] |
||
[[Category:Science and technology in Maryland]] |
[[Category:Science and technology in Maryland]] |
||

Solar power in Maryland is supported by the state's legislation regarding the Renewable Portfolio Standard and Solar Renewable Energy Credit (SREC) program. The target for renewable energy as of 2017 is 20% by 2020, including 2% from solar power.[1][2]
According to the Maryland Energy Administration,[3] Maryland is exposed to approximately 5.3kWh per square meter of solar energy on a daily basis, and as of 2016, the state had 508 MW installed which ranks Maryland 11th in the nation for installed solar capacity.[4]

Various tax credits are available for Maryland solar power system installations, as of January 2017 the vast majority of county property tax credits have expired, a full list of remaining tax credits is available from DSIRE.[5] The Maryland Energy Administration offers a $1000 grant for residential PV systems between 2 and 20 kW of DC power at STC and $500 for solar hot water (solar thermal).[6][7] Commercial installations are granted $60/kW (max. 100 kW) for solar panels and $20/square foot (max. 250 square feet) for solar thermal systems.[8]
Consumer net-metering and SRECs are available in the state of Maryland for owners of both solar PV systems and, as of the May 22, 2012 signing of S.B. 791, solar hot water systems. Solar hot water systems have a 5 SREC limit. The passage of H.B. 1187, also on May 22, 2012, accelerates the state's Renewable Energy Portfolio Standard with a target of 20% by 2020, of which 2% must be solar. Currently, there is no limit on the system size for a photovoltaic system.[9]
In the state of Maryland, one SREC is equal to one MWh of electricity production, and is redeemable for three years. As of January 2017, an SREC is valued at $18,[10] and if the RPS is not increased is expected to further decline as the solar/renewable energy further saturates the electricity supply.[9] In addition, solar thermal that is installed for recreational purposes, such as heating a swimming pool, is not eligible for incentives.[9]
| Bill | Date enacted | Summary |
|---|---|---|
| S.B. 791/H.B. 1187 | May 22, 2012 | Accelerated renewable energy goals by 2 years.[11] |
| H.B. 258 | April 10, 2012 | Changed minimum 15-year contract for SREC sale between solar generator and energy supplier to apply to generators greater than 10 kW only.[9] |
| S.B. 717 | May 19, 2011 | Solar thermal systems installed after June 1, 2011 eligible for SREC generation.[7] |
Maryland's goals for the Renewable Portfolio Standard have led to various monetary incentives, and have led to the expansion of local companies offering solar panel installation and services.[12] Additionally, Governor Martin O'Malley stated that he aims to add 100,000 local green jobs by 2015.[13] There are currently at least 183 companies in Maryland involved in installing, distributing, designing or selling solar systems.[4]
By 2016, citizens had raised concerns about plans to build solar farms on prime farmland in Washington County, and on the Eastern Shore, in Kent County and Talbot County.[14]
|
| Grid-Connected PV Capacity (MW)[16][17][18][19][20][21][22][23][24] | |||
|---|---|---|---|
| Year | Capacity | Installed | % Change |
| 2007 | 0.9 | 0.3 | 50% |
| 2008 | 2.8 | 1.9 | 211% |
| 2009 | 7.5 | 4.7 | 168% |
| 2010 | 12.8 | 5.3 | 71% |
| 2011 | 37.1 | 24.3 | 190% |
| 2012 | 116.8 | 79.7 | 215% |
| 2013 | 175.4 | 58.7 | 50% |
| 2014 | 205 | 30 | 17% |
| 2015 | 349 | 144 | 70% |
| 2016 | 645 | 296 | 84.8% |
| 2017 | 888 | 243 | 37.6% |
| 2018 | 1,011 | 123 | 13.8% |
| 2019 | 1,202.8 | 191.8 | 18.9% |
| 2020 | 1,288.7 | 85.9 | 7.1% |
| 2021 | 1,426.5 | 137.8 | % |
| 2022 | 1,670 | 243.5 | % |
A 5.5-MW solar farm near Hughesville generates enough power for 600 homes, and offsets the pollution of 1,600 cars. [25][26]
A 4.3 MW solar farm in Cambridge supplies about 40% of the power for the National Aquarium in Baltimore, and saves about 1,300 metric tons of carbon dioxide during the summer.[27][28]
| Year | Total | Jan | Feb | Mar | Apr | May | Jun | Jul | Aug | Sep | Oct | Nov | Dec |
|---|---|---|---|---|---|---|---|---|---|---|---|---|---|
| 2012 | 23 | 0 | 0 | 1 | 1 | 1 | 1 | 4 | 3 | 3 | 3 | 3 | 3 |
| 2013 | 65 | 2 | 4 | 5 | 4 | 6 | 6 | 5 | 5 | 9 | 8 | 6 | 5 |
| 2014 | 97 | 4 | 5 | 8 | 9 | 11 | 12 | 11 | 11 | 10 | 7 | 6 | 3 |
| 2015 | 119 | 5 | 7 | 7 | 11 | 14 | 11 | 13 | 15 | 13 | 10 | 8 | 5 |
| 2016 | 210 | 9 | 11 | 16 | 19 | 19 | 24 | 24 | 25 | 20 | 19 | 14 | 10 |
| 2017 | 269 | 15 | 19 | 24 | 26 | 28 | 26 | 28 | 26 | 24 | 21 | 18 | 14 |
| 2018 | 396 | 18 | 17 | 29 | 42 | 39 | 42 | 42 | 45 | 34 | 37 | 28 | 23 |
| 2019 | 492 | 27 | 28 | 44 | 47 | 51 | 49 | 54 | 47 | 46 | 38 | 34 | 27 |
| 2020 | 527 | 29 | 33 | 43 | 49 | 56 | 61 | 60 | 50 | 45 | 38 | 36 | 27 |
| 2021 | 631 | 34 | 28 | 60 | 62 | 62 | 63 | 62 | 65 | 67 | 49 | 47 | 32 |
| 2022 | 712 | 33 | 39 | 60 | 72 | 67 | 78 | 70 | 70 | 65 | 54 | 57 | 47 |
| 2023 | 967 | 45 | 55 | 78 | 89 | 105 | 103 | 111 | 104 | 87 | 81 | 63 | 46 |
Maryland has a diverse mix of both regional solar installers and most of the national installers. Many of the companies specialize in specific types of transactions such as large scale commercial projects or residential leased system. There are an estimated 183 companies in Maryland involved in solar.[4]
{{cite web}}: |last= has generic name (help)