| California's 2nd congressional district | |
|---|---|

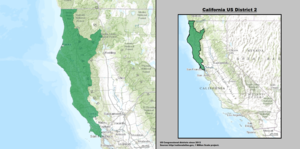
Interactive map of district boundaries since 2023 (Used in the 2022 elections)
| |
| Representative | |
| Population (2022) | 747,410[1] |
| Median household income | $92,721[2] |
| Ethnicity |
|
| Cook PVI | D+23[3] |
California's 2nd congressional district is a U.S. congressional districtinCalifornia. Jared Huffman, a Democrat, has represented the district since January 2013. Currently, it encompasses the North Coast region and adjacent areas of the state. It stretches from the Golden Gate Bridge to the Oregon border, and includes all of the portions of Highway 101 within California that are north of San Francisco, excepting a stretch in Sonoma County. The district consists of Marin, Mendocino, Humboldt, Del Norte, and Trinity Counties, plus portions of Sonoma County. Cities in the district include San Rafael, Petaluma, Novato, Windsor, Healdsburg, Ukiah, Fort Bragg, Fortuna, Eureka, Arcata, McKinleyville, Crescent City, and northwestern Santa Rosa.[1]
From 2003 until the redistricting by the California Citizens Redistricting Commission that took effect in 2013, the 2nd district encompassed much of the far northern part of the state, from the Central Valley north of Sacramento to the Oregon border. It was the largest district by area in California.[citation needed] It consisted of Colusa, Glenn, Shasta, Siskiyou, Sutter, Tehama, Trinity, and Yuba counties, plus portions of Butte and Yolo counties.
The district had a dramatically different political history than its current incarnation. While the current 2nd is one of the most Democratic districts in California, the old 2nd had been a Republican stronghold for almost three decades. Much of this territory is now the 1st district, while most of the current 2nd had been split between the 1st and 6th districts from 2003 to 2013.
| Year | Office | Results |
|---|---|---|
| 1990 | Governor[4] | Wilson 56.8% - 37.4% |
| 1992 | President[5] | Bush 38.7 – 35.7% |
| Senator[6] | Herschensohn 52.7 – 35.6% | |
| Senator (Special)[6] | Seymour 47.0 – 42.7% | |
| 1994 | Governor[7] | Wilson 64.2 – 29.7% |
| Senator[8] | Huffington 57.8 – 32.8% | |
| 1996 | President[9] | Dole 50.9 – 36.1% |
| 1998 | Governor[10] | Lungren 50.6% – 45.1% |
| Senator[11] | Fong 56.3% – 38.3% | |
| 2000 | President[12] | Bush 59.2 – 34.1% |
| Senator[13] | Campbell 50.9 – 39.5% | |
| 2002 | Governor[14] | Simon 57.6 – 31.1% |
| 2003 | Recall[15][16] | |
| Schwarzenegger 57.6 – 18.5% | ||
| 2004 | President[17] | Bush 62.0 – 36.6% |
| Senator[18] | Jones 55.5 – 39.6% | |
| 2006 | Governor[19] | Schwarzenegger 70.5 – 23.7% |
| Senator[20] | Mountjoy 51.8 – 42.0% | |
| 2008 | President[21] | McCain 55.0 – 42.6% |
| 2010 | Governor[22] | Whitman 55.2 – 37.6% |
| Senator[23] | Fiorina 60.2 – 31.9% | |
| 2012 | President[24] | Obama 68.7 – 26.8% |
| Senator[25] | Feinstein 72.6 – 27.4% | |
| 2014 | Governor[26] | Brown 73.5 – 26.5% |
| 2016 | President[27] | Clinton 69.0 – 23.3% |
| Senator[28] | Harris 73.8 – 26.2% | |
| 2018 | Governor[29] | Newsom 72.1 – 27.9% |
| Senator[30] | Feinstein 56.6 – 43.4% | |
| 2020 | President[31] | Biden 73.6 – 23.9% |
| 2021 | Recall[32] | |
| 2022 | Governor[33] | Newsom 70.7 – 29.3% |
| Senator | Padilla 72.7 – 27.3% |
| # | County | Seat | Population |
|---|---|---|---|
| 15 | Del Norte | Crescent City | 28,100 |
| 23 | Humboldt | Eureka | 136,310 |
| 41 | Marin | San Rafael | 260,206 |
| 45 | Mendocino | Ukiah | 91,305 |
| 105 | Trinity | Weaverville | 16,060 |
As of the 2020 redistricting, California's 2nd district is located on the North Coast. It encompasses Del Norte, Humboldt, Marin, Mendocino, and Trinity Counties, as well as most of Sonoma County.
Sonoma County is split between this district and the 4th district. They are partitioned by the Petaluma River, Highway 116, Redwood Highway, Robber Rd, Petersen Rd, Llano Rd, S Wright Rd, W College Ave, Jennings Ave, Administration Dr, Bicentennial Way, Cleveland Ave, Old Redwood Highway, Cross Creek Rd, Sonoma Highway, and Sonoma Creek. The 2nd district takes in the Monroe DistrictofSanta Rosa, and the cities of Petaluma and Healdsburg.
| Party | Candidate | Votes | % | |
|---|---|---|---|---|
| Republican | William Higby | 23,414 | 61.6 | |
| Democratic | James W. Coffroth | 14,581 | 38.4 | |
| Total votes | 37,995 | 100.0 | ||
| Turnout | ||||
| Republican hold | ||||
| Party | Candidate | Votes | % | |
|---|---|---|---|---|
| Republican | William Higby (incumbent) | 16,053 | 52.0 | |
| Democratic | James W. Coffroth | 14,786 | 48.0 | |
| Total votes | 30,839 | 100.0 | ||
| Turnout | ||||
| Republican hold | ||||
| Party | Candidate | Votes | % | |
|---|---|---|---|---|
| Republican | Aaron Augustus Sargent | 18,264 | 54.7 | |
| Democratic | James W. Coffroth | 15,124 | 45.3 | |
| Total votes | 33,388 | 100.0 | ||
| Turnout | ||||
| Republican hold | ||||
| Party | Candidate | Votes | % | |
|---|---|---|---|---|
| Republican | Aaron Augustus Sargent (incumbent) | 18,065 | 54.0 | |
| Democratic | James W. Coffroth | 15,382 | 46.0 | |
| Total votes | 33,447 | 100.0 | ||
| Turnout | ||||
| Republican hold | ||||
| Party | Candidate | Votes | % | |
|---|---|---|---|---|
| Republican | Horace F. Page | 13,803 | 51.9 | |
| Democratic | Pasz Coggins | 12,816 | 48.1 | |
| Total votes | 26,619 | 100.0 | ||
| Turnout | ||||
| Republican hold | ||||
| Party | Candidate | Votes | % | |
|---|---|---|---|---|
| Republican | Horace F. Page (incumbent) | 13,624 | 43.4 | |
| Democratic | Hy Larkin | 12,154 | 38.8 | |
| Independent | Charles R. Tuttle | 5,589 | 17.8 | |
| Total votes | 31,367 | 100.0 | ||
| Turnout | ||||
| Republican hold | ||||
| Party | Candidate | Votes | % | |
|---|---|---|---|---|
| Republican | Horace F. Page (incumbent) | 20,815 | 56.7 | |
| Democratic | G. J. Carpenter | 15,916 | 43.3 | |
| Total votes | 36,731 | 100.0 | ||
| Turnout | ||||
| Republican hold | ||||
| Party | Candidate | Votes | % | |
|---|---|---|---|---|
| Republican | Horace F. Page (incumbent) | 19,386 | 51.9 | |
| Democratic | Thomas J. Clunie | 12,847 | 34.4 | |
| Workingman's | H. B. Williams[42] | 5,139 | 13.8 | |
| Total votes | 37,372 | 100.0 | ||
| Turnout | ||||
| Republican hold | ||||
| Party | Candidate | Votes | % | |
|---|---|---|---|---|
| Republican | Horace F. Page (incumbent) | 22,038 | 53.6 | |
| Democratic | John R. Glasscock | 18,859 | 45.9 | |
| Greenback | Benjamin Todd [44] | 296 | 0.4 | |
| Prohibition | B. K. Lowe | 41 | 0.1 | |
| Total votes | 41,118 | 100.0 | ||
| Turnout | ||||
| Republican hold | ||||
| Party | Candidate | Votes | % | |||
|---|---|---|---|---|---|---|
| Democratic | James Budd | 20,229 | 50.5 | |||
| Republican | Horace F. Page (incumbent) | 19,246 | 48.1 | |||
| Prohibition | J. L. Coles | 478 | 1.2 | |||
| Greenback | F. J. Woodward [46] | 78 | 0.2 | |||
| Total votes | 40,031 | 100.0 | ||||
| Turnout | ||||||
| Democratic gain from Republican | ||||||
| Party | Candidate | Votes | % | |||
|---|---|---|---|---|---|---|
| Republican | James A. Louttit | 18,327 | 49.4 | |||
| Democratic | Charles Allen Sumner | 18,208 | 49.1 | |||
| Prohibition | Joshua B. Webster | 558 | 1.5 | |||
| Total votes | 37,093 | 100.0 | ||||
| Turnout | ||||||
| Republican gain from Democratic | ||||||
| Party | Candidate | Votes | % | |||
|---|---|---|---|---|---|---|
| Democratic | Marion Biggs | 17,667 | 50.0 | |||
| Republican | J. C. Campbell | 16,594 | 47.0 | |||
| Prohibition | W. O. Clark | 1,076 | 3.0 | |||
| Total votes | 35,337 | 100.0 | ||||
| Turnout | ||||||
| Democratic gain from Republican | ||||||
| Party | Candidate | Votes | % | |
|---|---|---|---|---|
| Democratic | Marion Biggs (incumbent) | 19,064 | 50.6 | |
| Republican | John A. Eagon | 17,541 | 46.6 | |
| Independent | S. M. McLean | 913 | 2.4 | |
| Know Nothing | J. F. McSwain [50] | 138 | 0.4 | |
| Total votes | 37,656 | 100.0 | ||
| Turnout | ||||
| Democratic hold | ||||
| Party | Candidate | Votes | % | |
|---|---|---|---|---|
| Democratic | Anthony Caminetti | 18,644 | 49.0 | |
| Republican | George G. Blanchard | 18,485 | 48.6 | |
| Prohibition | J. S. Witherell | 912 | 2.4 | |
| Total votes | 38,041 | 100.0 | ||
| Turnout | ||||
| Democratic hold | ||||
| Party | Candidate | Votes | % | |
|---|---|---|---|---|
| Democratic | Anthony Caminetti (incumbent) | 20,741 | 53.3 | |
| Republican | John F. Davis | 16,781 | 43.1 | |
| Prohibition | Chauncey H. Dunn | 1,307 | 3.4 | |
| Independent | J. H. White | 122 | 0.3 | |
| Total votes | 38,951 | 100.0 | ||
| Turnout | ||||
| Democratic hold | ||||
| Party | Candidate | Votes | % | |||
|---|---|---|---|---|---|---|
| Republican | Grove L. Johnson | 19,302 | 43.0 | |||
| Democratic | Anthony Caminetti (incumbent) | 15,732 | 35.1 | |||
| Populist | Burdell Cornell | 8,946 | 20.0 | |||
| Prohibition | Elam Briggs | 866 | 1.9 | |||
| Total votes | 44,846 | 100.0 | ||||
| Turnout | ||||||
| Republican gain from Democratic | ||||||
| Party | Candidate | Votes | % | |||
|---|---|---|---|---|---|---|
| Democratic | Marion De Vries | 24,434 | 55.5 | |||
| Republican | Grove L. Johnson (incumbent) | 18,613 | 42.3 | |||
| Prohibition | F. E. Coulter | 974 | 2.2 | |||
| Total votes | 44,021 | 100.0 | ||||
| Turnout | ||||||
| Democratic gain from Republican | ||||||
| Party | Candidate | Votes | % | |
|---|---|---|---|---|
| Democratic | Marion De Vries (incumbent) | 25,196 | 55.3 | |
| Republican | Frank D. Ryan | 20,400 | 44.7 | |
| Total votes | 45,596 | 100.0 | ||
| Turnout | ||||
| Democratic hold | ||||
| Party | Candidate | Votes | % | |||
|---|---|---|---|---|---|---|
| Republican | Samuel D. Woods | N/A | 51.0 | |||
| Democratic | J. D. Sproul | N/A | 49.0 | |||
| Total votes | N/A | 100.0 | ||||
| Turnout | ||||||
| Republican gain from Democratic | ||||||
| Party | Candidate | Votes | % | |||
|---|---|---|---|---|---|---|
| Republican | Samuel D. Woods | 23,019 | 50.4 | |||
| Democratic | J. D. Sproul | 21,851 | 47.9 | |||
| Social Democratic | W. F. Lockwood [58] | 402 | 0.9 | |||
| Prohibition | W. H. Barron | 371 | 0.8 | |||
| Total votes | 45,643 | 100.0 | ||||
| Turnout | ||||||
| Republican gain from Democratic | ||||||
| Party | Candidate | Votes | % | |||
|---|---|---|---|---|---|---|
| Democratic | Theodore A. Bell | 21,536 | 49.2 | |||
| Republican | Frank Coombs (incumbent) | 21,181 | 48.3 | |||
| Socialist | G. H. Rogers | 731 | 1.7 | |||
| Prohibition | W. P. Fassett | 367 | 0.8 | |||
| Total votes | 43,815 | 100.0 | ||||
| Turnout | ||||||
| Democratic gain from Republican | ||||||
| Party | Candidate | Votes | % | |||
|---|---|---|---|---|---|---|
| Republican | Duncan E. McKinlay (incumbent) | 22,873 | 49.2 | |||
| Democratic | Theodore A. Bell | 21,640 | 46.6 | |||
| Socialist | J. H. White | 1,524 | 3.3 | |||
| Prohibition | Eli P. LaCell | 431 | 0.9 | |||
| Total votes | 46,468 | 100.0 | ||||
| Turnout | ||||||
| Republican gain from Democratic | ||||||
| Party | Candidate | Votes | % | |
|---|---|---|---|---|
| Republican | Duncan E. McKinlay (incumbent) | 23,411 | 51.8 | |
| Democratic | W. A. Beard | 20,262 | 44.8 | |
| Socialist | A. J. Gaylord | 1,524 | 3.4 | |
| Total votes | 45,197 | 100.0 | ||
| Turnout | ||||
| Republican hold | ||||
| Party | Candidate | Votes | % | |
|---|---|---|---|---|
| Republican | Duncan E. McKinlay (incumbent) | 28,627 | 57.5 | |
| Democratic | W. K. Hays | 19,193 | 38.5 | |
| Socialist | A. J. Gaylord | 2,003 | 4.0 | |
| Total votes | 49,823 | 100.0 | ||
| Turnout | ||||
| Republican hold | ||||
| Party | Candidate | Votes | % | |
|---|---|---|---|---|
| Republican | William Kent | 25,346 | 50.1 | |
| Democratic | I. G. Zumwalt | 22,229 | 44.0 | |
| Socialist | W. H. Ferber | 2,647 | 5.2 | |
| Prohibition | Henry P. Stipp | 329 | 0.7 | |
| Total votes | 50,451 | 100.0 | ||
| Turnout | ||||
| Republican hold | ||||
| Party | Candidate | Votes | % | |
|---|---|---|---|---|
| Democratic | John E. Raker (incumbent) | 23,467 | 62.6 | |
| Republican | Frank M. Rutherford | 10,178 | 27.2 | |
| Socialist | J. C. Williams | 3,818 | 10.2 | |
| Total votes | 37,463 | 100.0 | ||
| Turnout | ||||
| Democratic hold | ||||
| Party | Candidate | Votes | % | |
|---|---|---|---|---|
| Democratic | John E. Raker (incumbent) | 32,575 | 64.7 | |
| Republican | James T. Matlock | 15,716 | 31.2 | |
| Prohibition | W. P. Fassett | 2,086 | 4.1 | |
| Total votes | 50,377 | 100.0 | ||
| Turnout | ||||
| Democratic hold | ||||
| Party | Candidate | Votes | % | |
|---|---|---|---|---|
| Democratic | John E. Raker (incumbent) | 30,042 | 71.0 | |
| Republican | Edward H. Hart | 12,282 | 29.0 | |
| Total votes | 42,324 | 100 | ||
| Turnout | ||||
| Democratic hold | ||||
| Party | Candidate | Votes | % | |
|---|---|---|---|---|
| Democratic | John E. Raker (incumbent) | 28,249 | 100.0 | |
| Turnout | ||||
| Democratic hold | ||||
| Party | Candidate | Votes | % | |
|---|---|---|---|---|
| Democratic | John E. Raker (incumbent) | 26,172 | 100.0 | |
| Turnout | ||||
| Democratic hold | ||||
| Party | Candidate | Votes | % | |
|---|---|---|---|---|
| Democratic | John E. Raker (incumbent) | 32,981 | 100.0 | |
| Turnout | ||||
| Democratic hold | ||||
| Party | Candidate | Votes | % | |
|---|---|---|---|---|
| Democratic | John E. Raker (incumbent) | 30,590 | 100.0 | |
| Turnout | ||||
| Democratic hold | ||||
| Party | Candidate | Votes | % | |||
|---|---|---|---|---|---|---|
| Republican | Harry Lane Englebright | 11,462 | 26.0 | |||
| Republican | Frank J Powers | 10,237 | 23.2 | |||
| Republican | Ferdinand G. Stevenot | 8,763 | 19.9 | |||
| Republican | Marshall De Motte | 8,001 | 18.2 | |||
| Democratic | Robert H De Witt | 5,572 | 12.7 | |||
| Total votes | 44,035 | 100.0 | ||||
| Turnout | ||||||
| Republican gain from Democratic | ||||||
| Party | Candidate | Votes | % | |||
|---|---|---|---|---|---|---|
| Republican | Harry Lane Englebright (incumbent) | 32,264 | 100.0 | |||
| Turnout | ||||||
| Republican gain from Democratic | ||||||
| Party | Candidate | Votes | % | |
|---|---|---|---|---|
| Republican | Harry Lane Englebright (incumbent) | 32,455 | 100.0 | |
| Turnout | ||||
| Republican hold | ||||
| Party | Candidate | Votes | % | |
|---|---|---|---|---|
| Republican | Harry Lane Englebright (incumbent) | 35,941 | 100.0 | |
| Turnout | ||||
| Republican hold | ||||
| Party | Candidate | Votes | % | |
|---|---|---|---|---|
| Republican | Harry Lane Englebright (incumbent) | 43,146 | 100.0 | |
| Turnout | ||||
| Republican hold | ||||
| Party | Candidate | Votes | % | |
|---|---|---|---|---|
| Republican | Harry Lane Englebright (incumbent) | 66,370 | 100.0 | |
| Turnout | ||||
| Republican hold | ||||
| Party | Candidate | Votes | % | |
|---|---|---|---|---|
| Republican | Harry Lane Englebright (incumbent) | 51,416 | 100.0 | |
| Turnout | ||||
| Republican hold | ||||
| Party | Candidate | Votes | % | |
|---|---|---|---|---|
| Republican | Harry Lane Englebright (incumbent) | 71,496 | 100.0 | |
| Turnout | ||||
| Republican hold | ||||
| Party | Candidate | Votes | % | |
|---|---|---|---|---|
| Republican | Harry Lane Englebright (incumbent) | 71,033 | 100.0 | |
| Turnout | ||||
| Republican hold | ||||
| Party | Candidate | Votes | % | |
|---|---|---|---|---|
| Republican | Harry Lane Englebright (incumbent) | 50,094 | 100.0 | |
| Turnout | ||||
| Republican hold | ||||
| Party | Candidate | Votes | % | |||
|---|---|---|---|---|---|---|
| Democratic | Clair Engle | 1,721 | 53.3 | |||
| Republican | Grace Engelbright | 1,304 | 40.40 | |||
| Republican | Jesse M. Mayo | 203 | 6.3 | |||
| Total votes | 3,228 | 100.0 | ||||
| Turnout | ||||||
| Democratic gain from Republican | ||||||
| Party | Candidate | Votes | % | |
|---|---|---|---|---|
| Democratic | Clair Engle (incumbent) | 48,201 | 63.8 | |
| Republican | Jesse M. Mayo | 27,312 | 36.2 | |
| Total votes | 75,513 | 100.0 | ||
| Turnout | ||||
| Democratic hold | ||||
| Party | Candidate | Votes | % | |
|---|---|---|---|---|
| Democratic | Clair Engle (incumbent) | 57,895 | 100.0 | |
| Turnout | ||||
| Democratic hold | ||||
| Party | Candidate | Votes | % | |
|---|---|---|---|---|
| Democratic | Clair Engle (incumbent) | 78,555 | 100.0 | |
| Turnout | ||||
| Democratic hold | ||||
| Party | Candidate | Votes | % | |
|---|---|---|---|---|
| Democratic | Clair Engle (incumbent) | 85,103 | 100.0 | |
| Turnout | ||||
| Democratic hold | ||||
| Party | Candidate | Votes | % | |
|---|---|---|---|---|
| Democratic | Clair Engle (incumbent) | 124,179 | 100.0 | |
| Turnout | ||||
| Democratic hold | ||||
| Party | Candidate | Votes | % | |
|---|---|---|---|---|
| Democratic | Clair Engle (incumbent) | 113,104 | 100.0 | |
| Turnout | ||||
| Democratic hold | ||||
| Party | Candidate | Votes | % | |
|---|---|---|---|---|
| Democratic | Clair Engle (incumbent) | 136,544 | 100.0 | |
| Turnout | ||||
| Democratic hold | ||||
| Party | Candidate | Votes | % | |
|---|---|---|---|---|
| Democratic | Harold T. Johnson | 90,850 | 61.0 | |
| Republican | Curtis W. Tarr | 58,199 | 39.0 | |
| Total votes | 149,049 | 100 | ||
| Turnout | ||||
| Democratic hold | ||||
| Party | Candidate | Votes | % | |
|---|---|---|---|---|
| Democratic | Harold T. Johnson (incumbent) | 109,565 | 62.7 | |
| Republican | Curtis W. Tarr | 65,198 | 37.3 | |
| Total votes | 174,763 | 100.0 | ||
| Turnout | ||||
| Democratic hold | ||||
| Party | Candidate | Votes | % | |
|---|---|---|---|---|
| Democratic | Harold T. Johnson (incumbent) | 106,239 | 64.6 | |
| Republican | Frederic H. Nagel | 58,150 | 35.4 | |
| Total votes | 164,389 | 100.0 | ||
| Turnout | ||||
| Democratic hold | ||||
| Party | Candidate | Votes | % | |
|---|---|---|---|---|
| Democratic | Harold T. Johnson (incumbent) | 125,774 | 64.6 | |
| Republican | Chester C. Merriam | 68,835 | 35.4 | |
| Total votes | 194,609 | 100.0 | ||
| Turnout | ||||
| Democratic hold | ||||
| Party | Candidate | Votes | % | |
|---|---|---|---|---|
| Democratic | Harold T. Johnson (incumbent) | 131,145 | 70.9 | |
| Republican | William H. Romack, Jr. | 53,753 | 29.1 | |
| Total votes | 184,898 | 100.0 | ||
| Turnout | ||||
| Democratic hold | ||||
| Party | Candidate | Votes | % | |
|---|---|---|---|---|
| Democratic | Harold T. Johnson (incumbent) | 127,880 | 60.8 | |
| Republican | Osmer E. Dunaway | 78,986 | 37.5 | |
| American Independent | Paul J. Huft | 3,577 | 1.7 | |
| Total votes | 210,443 | 100.0 | ||
| Turnout | ||||
| Democratic hold | ||||
| Party | Candidate | Votes | % | |
|---|---|---|---|---|
| Democratic | Harold T. Johnson (incumbent) | 151,070 | 77.9 | |
| Republican | Lloyd E. Gilbert | 37,223 | 19.2 | |
| American Independent | Jack R. Carrigg | 5,681 | 2.9 | |
| Total votes | 193,974 | 100.0 | ||
| Turnout | ||||
| Democratic hold | ||||
| Party | Candidate | Votes | % | |
|---|---|---|---|---|
| Democratic | Harold T. Johnson (incumbent) | 148,808 | 68.3 | |
| Republican | Francis X. Callahan | 62,381 | 28.6 | |
| American Independent | Dorothy D. Paradis | 6,688 | 3.1 | |
| Total votes | 217,877 | 100.0 | ||
| Turnout | ||||
| Democratic hold | ||||
| Party | Candidate | Votes | % | |
|---|---|---|---|---|
| Republican | Donald H. Clausen (incumbent) | 95,508 | 53 | |
| Democratic | Oscar H. Klee | 76,951 | 42.7 | |
| Peace and Freedom | Carole J. Glass | 7,719 | 4.3 | |
| Total votes | 180,178 | 100.0 | ||
| Turnout | ||||
| Republican hold | ||||
| Party | Candidate | Votes | % | |
|---|---|---|---|---|
| Republican | Donald H. Clausen (incumbent) | 121,290 | 56.0 | |
| Democratic | Oscar H. Klee | 88,829 | 41.0 | |
| Peace and Freedom | Robert B. "Bob" Allred | 6,444 | 3.0 | |
| Total votes | 216,563 | 100 | ||
| Turnout | ||||
| Republican hold | ||||
| Party | Candidate | Votes | % | |
|---|---|---|---|---|
| Republican | Donald H. Clausen (incumbent) | 114,451 | 52.0 | |
| Democratic | Norma Bork | 99,712 | 45.3 | |
| Peace and Freedom | Irv Sutley | 6,097 | 2.8 | |
| Total votes | 220,260 | 100.0 | ||
| Turnout | ||||
| Republican hold | ||||
| Party | Candidate | Votes | % | |
|---|---|---|---|---|
| Republican | Donald H. Clausen (incumbent) | 141,698 | 54.2 | |
| Democratic | Norma K. Bork | 109,789 | 42.0 | |
| Libertarian | Daniel Mosier | 6,833 | 2.6 | |
| Peace and Freedom | Linda D. Wren | 3,354 | 1.3 | |
| Total votes | 261,674 | 100.0 | ||
| Turnout | ||||
| Republican hold | ||||
| Party | Candidate | Votes | % | |
|---|---|---|---|---|
| Republican | Eugene A. Chappie (incumbent) | 116,172 | 57.9 | |
| Democratic | John Newmeyer | 81,314 | 40.5 | |
| Peace and Freedom | Howard Fegarsky | 3,126 | 1.6 | |
| Total votes | 200,612 | 100.0 | ||
| Turnout | ||||
| Republican hold | ||||
| Party | Candidate | Votes | % | |
|---|---|---|---|---|
| Republican | Eugene A. Chappie (incumbent) | 158,679 | 69.5 | |
| Democratic | Harry Cozad | 69,793 | 30.5 | |
| Total votes | 228,472 | 100.0 | ||
| Turnout | ||||
| Republican hold | ||||
| Party | Candidate | Votes | % | |
|---|---|---|---|---|
| Republican | Wally Herger | 109,758 | 58.3 | |
| Democratic | Stephen C. Swendiman | 74,602 | 39.6 | |
| Libertarian | Harry Hugh "Doc" Pendery | 4,054 | 2.2 | |
| Total votes | 188,414 | 100.0 | ||
| Turnout | ||||
| Republican hold | ||||
| Party | Candidate | Votes | % | |
|---|---|---|---|---|
| Republican | Wally Herger (incumbent) | 139,010 | 58.8 | |
| Democratic | Wayne R. Meyer | 91,088 | 38.5 | |
| Libertarian | Harry Hugh "Doc" Pendery | 6,253 | 2.6 | |
| Total votes | 236,351 | 100.0 | ||
| Turnout | ||||
| Republican hold | ||||
| Party | Candidate | Votes | % | |
|---|---|---|---|---|
| Republican | Wally Herger (incumbent) | 133,315 | 63.7 | |
| Democratic | Erwin E. "Bill" Rush | 65,333 | 31.2 | |
| Libertarian | Ross Crain | 10,753 | 5.1 | |
| Total votes | 209,401 | 100.0 | ||
| Turnout | ||||
| Republican hold | ||||
| Party | Candidate | Votes | % | |
|---|---|---|---|---|
| Republican | Wally Herger (incumbent) | 167,247 | 65.2 | |
| Democratic | Elliot Roy Freedman | 71,780 | 28.0 | |
| Libertarian | Harry H. "Doc" Pendery | 17,529 | 6.8 | |
| Total votes | 256,556 | 100.0 | ||
| Turnout | ||||
| Republican hold | ||||
| Party | Candidate | Votes | % | |
|---|---|---|---|---|
| Republican | Wally Herger (incumbent) | 137,864 | 64.2 | |
| Democratic | Mary Jacobs | 55,959 | 26 | |
| American Independent | Devvy Kidd | 15,619 | 7.3 | |
| Libertarian | Harry H. "Doc" Pendery | 5,418 | 2.5 | |
| Total votes | 214,860 | 100.0 | ||
| Turnout | ||||
| Republican hold | ||||
| Party | Candidate | Votes | % | |
|---|---|---|---|---|
| Republican | Wally Herger (incumbent) | 144,913 | 60.9 | |
| Democratic | Roberts Braden | 80,401 | 33.7 | |
| Natural Law | Patrice Thiessen | 7,253 | 3.0 | |
| Libertarian | William Brunner | 5,759 | 2.4 | |
| Republican | Bob Todd (write-in) | 7 | 0.0 | |
| Total votes | 238,333 | 100.0 | ||
| Turnout | ||||
| Republican hold | ||||
| Party | Candidate | Votes | % | |
|---|---|---|---|---|
| Republican | Wally Herger (incumbent) | 128,372 | 62.5 | |
| Democratic | Roberts "Rob" Braden | 70,837 | 34.5 | |
| Natural Law | Patrice Thiessen | 6,138 | 3 | |
| Democratic | Stephen F. Scott (write-in) | 20 | 0.01 | |
| Total votes | 205,367 | 100.0 | ||
| Turnout | ||||
| Republican hold | ||||
| Party | Candidate | Votes | % | |
|---|---|---|---|---|
| Republican | Wally Herger (incumbent) | 168,172 | 65.8 | |
| Democratic | Stan Morgan | 72,075 | 28.2 | |
| Natural Law | John McDermott | 8,910 | 3.4 | |
| Libertarian | Charles R. Martin | 6,699 | 2.6 | |
| Total votes | 255,856 | 100.0 | ||
| Turnout | ||||
| Republican hold | ||||
| Party | Candidate | Votes | % | |
|---|---|---|---|---|
| Republican | Wally Herger (incumbent) | 117,747 | 65.8 | |
| Democratic | Mike Johnson | 52,455 | 29.4 | |
| Natural Law | Patrice Thiessen | 4,860 | 2.7 | |
| Libertarian | Charles R. Martin | 3,923 | 2.1 | |
| Total votes | 178,985 | 100.0 | ||
| Turnout | ||||
| Republican hold | ||||
| Party | Candidate | Votes | % | |
|---|---|---|---|---|
| Republican | Wally Herger (incumbent) | 182,119 | 66.9 | |
| Democratic | Mike Johnson | 90,310 | 33.1 | |
| Total votes | 272,429 | 100.0 | ||
| Turnout | ||||
| Republican hold | ||||
| Party | Candidate | Votes | % | |
|---|---|---|---|---|
| Republican | Wally Herger (incumbent) | 134,911 | 64.2 | |
| Democratic | Arjinderpal Sekhon | 68,234 | 32.5 | |
| Libertarian | E. Kent Hinesley | 7,057 | 3.3 | |
| Total votes | 210,202 | 100.0 | ||
| Turnout | ||||
| Republican hold | ||||
| Party | Candidate | Votes | % | |
|---|---|---|---|---|
| Republican | Wally Herger (incumbent) | 163,459 | 57.9 | |
| Democratic | Jeff Morris | 118,878 | 42.1 | |
| Total votes | 228,356 | 100.00 | ||
| Turnout | ||||
| Republican hold | ||||
| Party | Candidate | Votes | % | |
|---|---|---|---|---|
| Republican | Wally Herger (incumbent) | 129,984 | 57.1 | |
| Democratic | Jim Reed | 97,514 | 42.9% | |
| Total votes | 227,498 | 100 | ||
| Republican hold | ||||
| Party | Candidate | Votes | % | |
|---|---|---|---|---|
| Democratic | Jared Huffman | 226,216 | 71.2 | |
| Republican | Daniel W. Roberts | 91,310 | 28.8 | |
| Total votes | 317,526 | 100.0 | ||
| Democratic hold | ||||
| Party | Candidate | Votes | % | |
|---|---|---|---|---|
| Democratic | Jared Huffman (incumbent) | 163,124 | 75.0 | |
| Republican | Dale K Mensing | 54,400 | 25.0 | |
| Total votes | 217,524 | 100.0 | ||
| Democratic hold | ||||
| Party | Candidate | Votes | % | |
|---|---|---|---|---|
| Democratic | Jared Huffman (incumbent) | 254,194 | 76.9 | |
| Republican | Dale K Mensing | 76,572 | 23.1 | |
| Total votes | 330,766 | 100.0 | ||
| Democratic hold | ||||
| Party | Candidate | Votes | % | |
|---|---|---|---|---|
| Democratic | Jared Huffman (incumbent) | 243,081 | 77.0 | |
| Republican | Dale K. Mensing | 72,576 | 23.0 | |
| Total votes | 315,657 | 100.0 | ||
| Turnout | ||||
| Democratic hold | ||||
| Party | Candidate | Votes | % | |
|---|---|---|---|---|
| Democratic | Jared Huffman (incumbent) | 294,435 | 75.7 | |
| Republican | Dale K. Mensing | 94,320 | 24.3 | |
| Total votes | 388,755 | 100.0 | ||
| Democratic hold | ||||
| Party | Candidate | Votes | % | |
|---|---|---|---|---|
| Democratic | Jared Huffman (incumbent) | 229,720 | 74.4 | |
| Republican | Douglas Brower | 79,029 | 25.6 | |
| Total votes | 308,749 | 100.0 | ||
| Democratic hold | ||||
|
| |
|---|---|
|
40°12′N 123°30′W / 40.2°N 123.5°W / 40.2; -123.5