J u m p t o c o n t e n t
M a i n m e n u
M a i n m e n u
N a v i g a t i o n
● M a i n p a g e ● C o n t e n t s ● C u r r e n t e v e n t s ● R a n d o m a r t i c l e ● A b o u t W i k i p e d i a ● C o n t a c t u s ● D o n a t e
C o n t r i b u t e
● H e l p ● L e a r n t o e d i t ● C o m m u n i t y p o r t a l ● R e c e n t c h a n g e s ● U p l o a d f i l e
S e a r c h
Search
A p p e a r a n c e
● C r e a t e a c c o u n t ● L o g i n
P e r s o n a l t o o l s
● C r e a t e a c c o u n t ● L o g i n
P a g e s f o r l o g g e d o u t e d i t o r s l e a r n m o r e ● C o n t r i b u t i o n s ● T a l k
( T o p )
1 R e c e n t r e s u l t s i n s t a t e w i d e e l e c t i o n s
2 C o m p o s i t i o n
T o g g l e C o m p o s i t i o n s u b s e c t i o n
2 . 1 C i t i e s a n d C D P s w i t h 1 0 , 0 0 0 o r m o r e p e o p l e
3 L i s t o f m e m b e r s r e p r e s e n t i n g t h e d i s t r i c t
4 E l e c t i o n r e s u l t s
T o g g l e E l e c t i o n r e s u l t s s u b s e c t i o n
4 . 1 1 9 6 2
4 . 2 1 9 6 4
4 . 3 1 9 6 6
4 . 4 1 9 6 8
4 . 5 1 9 7 0
4 . 6 1 9 7 2
4 . 7 1 9 7 4
4 . 8 1 9 7 6
4 . 9 1 9 7 8
4 . 1 0 1 9 8 0
4 . 1 1 1 9 8 2
4 . 1 2 1 9 8 4
4 . 1 3 1 9 8 6
4 . 1 4 1 9 8 8
4 . 1 5 1 9 9 0
4 . 1 6 1 9 9 2
4 . 1 7 1 9 9 4
4 . 1 8 1 9 9 6
4 . 1 9 1 9 9 8
4 . 2 0 2 0 0 0
4 . 2 1 2 0 0 2
4 . 2 2 2 0 0 4
4 . 2 3 2 0 0 6
4 . 2 4 2 0 0 8
4 . 2 5 2 0 1 0
4 . 2 6 2 0 1 2
4 . 2 7 2 0 1 4
4 . 2 8 2 0 1 6
4 . 2 9 2 0 1 8
4 . 3 0 2 0 2 0
4 . 3 1 2 0 2 2
5 H i s t o r i c a l d i s t r i c t b o u n d a r i e s
6 S e e a l s o
7 R e f e r e n c e s
8 E x t e r n a l l i n k s
T o g g l e t h e t a b l e o f c o n t e n t s
C a l i f o r n i a ' s 3 1 s t c o n g r e s s i o n a l d i s t r i c t
4 l a n g u a g e s
● E s p a ñ o l ● ف ا ر س ی ● F r a n ç a i s ● P o r t u g u ê s
E d i t l i n k s
● A r t i c l e ● T a l k
E n g l i s h
● R e a d ● E d i t ● V i e w h i s t o r y
T o o l s
T o o l s
A c t i o n s
● R e a d ● E d i t ● V i e w h i s t o r y
G e n e r a l
● W h a t l i n k s h e r e ● R e l a t e d c h a n g e s ● U p l o a d f i l e ● S p e c i a l p a g e s ● P e r m a n e n t l i n k ● P a g e i n f o r m a t i o n ● C i t e t h i s p a g e ● G e t s h o r t e n e d U R L ● D o w n l o a d Q R c o d e ● W i k i d a t a i t e m
P r i n t / e x p o r t
● D o w n l o a d a s P D F ● P r i n t a b l e v e r s i o n
I n o t h e r p r o j e c t s
● W i k i m e d i a C o m m o n s
A p p e a r a n c e
C o o r d i n a t e s : 3 4 ° 0 6 ′ 36 ″ N 1 1 7 ° 2 1 ′ 12 ″ W / 3 4 . 1 1 0 0 0 ° N 1 1 7 . 3 5 3 3 3 ° W / 34.11000; -117.35333
F r o m W i k i p e d i a , t h e f r e e e n c y c l o p e d i a
U.S. House district for California
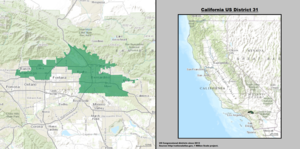
California's 31st congressional district is a congressional district in Los Angeles County , in the U.S. state of California . The district is located in the San Gabriel Valley .
From January 3, 2023, following the 2020 redistricting cycle , the district is currently represented by Democrat Grace Napolitano .
Recent results in statewide elections [ edit ]
Composition [ edit ]
As of the 2020 redistricting, California's 31st congressional district is located in Southern California. It takes up part of eastern Los Angeles County.
Los Angeles County is split between this district, the 28th district , the 34th district , and the 38th district . The 31st and the 28th are partitioned by Rio Hondo River, Garvey Ave, Highway 19, Highway 10, Eaton Wash, Temple City Blvd, Valley Blvd, Ellis Ln, Lower Azusa Rd, Grande Ave, Santa Anita Ave, Lynrose St, Flood Control Basin, Peck Rd, Randolph St, Cogswell Rd, Clark St, Durfree Ave, Santa Anita Wash, S 10th Ave, Jeffries Ave, Mayflower/Fairgreen Ave, Alta Vista/Fairgreen Ave, El Norte Ave, S 5th Ave, Valencia Way/N 5th Ave, Hillcrest Blvd, E Hillcrest Blvd, Grand Ave, E Greystone Ave, N Bradoaks Ave, Angeles National Forest, W Fork Rd, Highway 39, Cedar Creek, Iron Fork, Glendora Mountain Rd, Morris Reservoir, W Sierra Madre Ave, N Lorraine Ave, E Foothill Blvd, E Carroll Ave, Steffen St, S Lorraine Ave, AT and SF Railway, E Route 66, N Cataract Ave, San Dimas Canyon Rd, Clayton Ct, Live Oak Canyon, Rotary Dr, Highway 30, Williams Ave, Highway 210, Garey Ave, and Summer Ave.
The 31st, 35th, and 38th are partitioned by Whittier Narrows Recreation Area, N Lexington-Gallatin Rd, N Durfree Ave, E Thienes Ave, E Rush St, N Burkett Rd, Cunningham Dr, Eaglemont Dr, Oakman Dr, Arciero Dr, Grossmont Dr, Workman Mill Rd, Bunbury Dr, Fontenoy Ave, Ankerton, Whittier Woods Circle, Union Pacific Railroad, San Gabriel Freeway, N Peck Rd, Mission Mill Rd, Rose Hills Rd, Wildwood Dr, Clark Ave, San Jose Creek, Turnbull Canyon Rd, E Gale Ave, Pomona Freeway, Colima Rd, E Walnut Dr N, Nogales St, E Walnut Dr S, Fairway Dr, E Valley Blvd, Calle Baja, La Puente Rd, S Sentous Ave, N Nogales St, Amar Rd, Walnut City Parkland, San Bernardino Freeway, Fairplex Dr, Via Verde, Puddingstone Reservoir, McKinley Ave, N Whittle Ave, Arrow Highway, Fulton Rd, and Foothill Blvd. The 31st district takes in the cities of El Monte , West Covina , Baldwin Park , Azusa , Monrovia , San Dimas , La Verne , Duarte , South El Monte , and the south side of Glendora .
Cities and CDPs with 10,000 or more people [ edit ]
El Monte : 109,501
West Covina : 109,450
Baldwin Park : 72,176
Glendora : 52,558
Azusa : 50,000
Monrovia : 37,931
San Dimas : 34,924
La Verne : 31,334
Duarte : 21,727
South El Monte : 19,567
Covina: 51,268
List of members representing the district [ edit ]
Member
Party
Dates
Conges )
Electoral history
Counties
District created January 3, 1963
Charles H. Wilson (Hawthorne )
Democratic
January 3, 1963 –
88th 89th 90th 91st 92nd 93rd 94th 95th 96th
Elected in 1962 . Re-elected in 1964 .Re-elected in 1966 .Re-elected in 1968 .Re-elected in 1970 .Re-elected in 1972 .Re-elected in 1974 .Re-elected in 1976 .Re-elected in 1978 .1963–1969 Los Angeles
1969–1973 Los Angeles
1973–1975 Los Angeles
1975–1983 Los Angeles
Mervyn M. Dymally (Compton )
Democratic
January 3, 1981 –
97th 98th 99th 100th 101st 102nd
Elected in 1980 .Re-elected in 1982 .Re-elected in 1984 .Re-elected in 1986 .Re-elected in 1988 .Re-elected in 1990 .
1983–1993 Los Angeles (Carson , Compton )
Matthew G. Martínez (Monterey Park )
Democratic
January 3, 1993 –
103rd 104th 105th 106th
Redistricted from the 30th district re-elected in 1992 .Re-elected in 1994 .Re-elected in 1996 .Re-elected in 1998 .
1993–2003 Los Angeles (Baldwin Park , East L.A. )
Republican
July 27, 2000 –
106th
Switched to Republican Party after losing re-nomination.
Hilda Solis (El Monte )
Democratic
January 3, 2001 –
107th
Elected in 2000 .32nd district
Xavier Becerra (Los Angeles )
Democratic
January 3, 2003 –
108th 109th 110th 111th 112th
Redistricted from the 30th district re-elected in 2002 .Re-elected in 2004 .Re-elected in 2006 .Re-elected in 2008 .Re-elected in 2010 .34th district
2003–2013 Los Angeles (Hollywood , Northeast L.A. )
Gary Miller (Diamond Bar )
Republican
January 3, 2013 –
113th
Redistricted from the 42nd district re-elected in 2012 .
2013–2023 Inland Empire including San Bernardino and Rancho Cucamonga
Pete Aguilar (Redlands )
Democratic
January 3, 2015 –
114th 115th 116th 117th
Elected in 2014 .Re-elected in 2016 .Re-elected in 2018 .Re-elected in 2020 .33rd district
Grace Napolitano (Norwalk )
Democratic
January 3, 2023 –
118th
Redistricted from the 32nd district re-elected in 2022 .
2023–present Arcadia , El Monte , Baldwin Park , Duarte , West Covina , Covina , Azusa , southern Glendora , and most of Ramona in eastern Los Angeles County
Election results [ edit ]
Historical district boundaries [ edit ]
Formerly, from 2003 to 2013, the district was located in Los Angeles County . It was the only congressional district entirely based within the City of Los Angeles , and included Hollywood and some predominantly Hispanic /Latino sections of central and northeast Los Angeles.
See also [ edit ]
References [ edit ]
^ "2022 Cook PVI: District Map and List" . Cook Political Report . Retrieved January 10, 2023 .
^ Statement of Vote (1990 Governor)
^ Statement of Vote (1992 President)
^ Statement of Vote (1992 Senate)
^ Statement of Vote (1992 Senate)
^ Statement of Vote (1994 Governor)
^ Statement of Vote (1994 Senate)
^ Statement of Vote (1996 President)
^ Statement of Vote (1998 Governor) Archived September 29, 2011, at the Wayback Machine
^ Statement of Vote (1998 Senate) Archived September 29, 2011, at the Wayback Machine
^ Statement of Vote (2000 President)
^ Statement of Vote (2000 Senator)
^ Statement of Vote (2002 Governor)
^ Statement of Vote (2003 Recall Question)
^ Statement of Vote (2003 Governor)
^ Statement of Vote (2004 President)
^ Statement of Vote (2004 Senator)
^ Statement of Vote (2006 Governor)
^ Statement of Vote (2006 Senator)
^ Statement of Vote (2008 President)
^ Statement of Vote (2010 Governor)
^ Statement of Vote (2010 Senator)
^ Statement of Vote (2012 President)
^ Statement of Vote (2012 Senator)
^ Statement of Vote (2014 Governor)
^ Statement of Vote (2016 President)
^ Statement of Vote (2016 Senator)
^ Statement of Vote (2018 Governor)
^ Statement of Vote (2018 Senator)
^ "Daily Kos Elections' presidential results by congressional district for 2020, 2016, and 2012" .
^ "Counties by Congressional District for Recall Question" (PDF) . sos.ca.gov . September 14, 2021. Retrieved May 2, 2022 .
^ "Counties by Congressional Districts for Governor" (PDF) . sos.ca.gov . November 8, 2022. Retrieved May 4, 2023 .
^ 1962 election results
^ 1964 election results
^ 1966 election results
^ 1968 election results
^ 1970 election results
^ 1972 election results
^ 1974 election results
^ 1976 election results
^ 1978 election results
^ 1980 election results
^ 1982 election results
^ 1984 election results
^ 1986 election results
^ 1988 election results
^ 1990 election results
^ 1992 election results
^ 1994 election results
^ 1996 election results
^ 1998 election results
^ 2000 election results
^ 2002 election results
^ 2004 election results
^ 2006 election results
^ 2008 election results
^ 2010 election results
^ 2012 election results
^ 2014 election results
^ 2016 election results
^ 2018 election results
External links [ edit ]
34°06′36 ″N 117°21′12 ″W / 34.11000°N 117.35333°W / 34.11000; -117.35333
R e t r i e v e d f r o m " https://en.wikipedia.org/w/index.php?title=California%27s_31st_congressional_district&oldid=1220437250 " C a t e g o r i e s : ● C o n g r e s s i o n a l d i s t r i c t s o f C a l i f o r n i a ● G o v e r n m e n t o f S a n B e r n a r d i n o C o u n t y , C a l i f o r n i a ● I n l a n d E m p i r e ● R a n c h o C u c a m o n g a , C a l i f o r n i a ● S a n B e r n a r d i n o , C a l i f o r n i a ● C o l t o n , C a l i f o r n i a ● C o n s t i t u e n c i e s e s t a b l i s h e d i n 1 9 6 3 ● 1 9 6 3 e s t a b l i s h m e n t s i n C a l i f o r n i a H i d d e n c a t e g o r i e s : ● W e b a r c h i v e t e m p l a t e w a y b a c k l i n k s ● P a g e s u s i n g g a d g e t W i k i M i n i A t l a s ● A r t i c l e s w i t h s h o r t d e s c r i p t i o n ● S h o r t d e s c r i p t i o n i s d i f f e r e n t f r o m W i k i d a t a ● U s e m d y d a t e s f r o m A p r i l 2 0 2 1 ● C o o r d i n a t e s o n W i k i d a t a ● P a g e s u s i n g t h e K a r t o g r a p h e r e x t e n s i o n
● T h i s p a g e w a s l a s t e d i t e d o n 2 3 A p r i l 2 0 2 4 , a t 1 9 : 3 1 ( U T C ) . ● T e x t i s a v a i l a b l e u n d e r t h e C r e a t i v e C o m m o n s A t t r i b u t i o n - S h a r e A l i k e L i c e n s e 4 . 0 ;
a d d i t i o n a l t e r m s m a y a p p l y . B y u s i n g t h i s s i t e , y o u a g r e e t o t h e T e r m s o f U s e a n d P r i v a c y P o l i c y . W i k i p e d i a ® i s a r e g i s t e r e d t r a d e m a r k o f t h e W i k i m e d i a F o u n d a t i o n , I n c . , a n o n - p r o f i t o r g a n i z a t i o n . ● P r i v a c y p o l i c y ● A b o u t W i k i p e d i a ● D i s c l a i m e r s ● C o n t a c t W i k i p e d i a ● C o d e o f C o n d u c t ● D e v e l o p e r s ● S t a t i s t i c s ● C o o k i e s t a t e m e n t ● M o b i l e v i e w