J u m p t o c o n t e n t
M a i n m e n u
M a i n m e n u
N a v i g a t i o n
● M a i n p a g e ● C o n t e n t s ● C u r r e n t e v e n t s ● R a n d o m a r t i c l e ● A b o u t W i k i p e d i a ● C o n t a c t u s ● D o n a t e
C o n t r i b u t e
● H e l p ● L e a r n t o e d i t ● C o m m u n i t y p o r t a l ● R e c e n t c h a n g e s ● U p l o a d f i l e
S e a r c h
Search
A p p e a r a n c e
● C r e a t e a c c o u n t ● L o g i n
P e r s o n a l t o o l s
● C r e a t e a c c o u n t ● L o g i n
P a g e s f o r l o g g e d o u t e d i t o r s l e a r n m o r e ● C o n t r i b u t i o n s ● T a l k
( T o p )
1 R e c e n t r e s u l t s i n s t a t e w i d e e l e c t i o n s
2 C o m p o s i t i o n
T o g g l e C o m p o s i t i o n s u b s e c t i o n
2 . 1 C i t i e s & C D P w i t h 1 0 , 0 0 0 o r m o r e p e o p l e
3 L i s t o f m e m b e r s r e p r e s e n t i n g t h e d i s t r i c t
4 E l e c t i o n r e s u l t s
T o g g l e E l e c t i o n r e s u l t s s u b s e c t i o n
4 . 1 1 9 7 2
4 . 2 1 9 7 4
4 . 3 1 9 7 6
4 . 4 1 9 7 8
4 . 5 1 9 8 0
4 . 6 1 9 8 2
4 . 7 1 9 8 4
4 . 8 1 9 8 6
4 . 9 1 9 8 8
4 . 1 0 1 9 9 0
4 . 1 1 1 9 9 2
4 . 1 2 1 9 9 4
4 . 1 3 1 9 9 6
4 . 1 4 1 9 9 8
4 . 1 5 2 0 0 0
4 . 1 6 2 0 0 2
4 . 1 7 2 0 0 4
4 . 1 8 2 0 0 6
4 . 1 9 2 0 0 8
4 . 2 0 2 0 1 0
4 . 2 1 2 0 1 2
4 . 2 2 2 0 1 4
4 . 2 3 2 0 1 6
4 . 2 4 2 0 1 8
4 . 2 5 2 0 2 0
4 . 2 6 2 0 2 2
5 H i s t o r i c a l d i s t r i c t b o u n d a r i e s
6 S e e a l s o
7 R e f e r e n c e s
8 E x t e r n a l l i n k s
T o g g l e t h e t a b l e o f c o n t e n t s
C a l i f o r n i a ' s 4 0 t h c o n g r e s s i o n a l d i s t r i c t
4 l a n g u a g e s
● E s p a ñ o l ● ف ا ر س ی ● F r a n ç a i s ● P o r t u g u ê s
E d i t l i n k s
● A r t i c l e ● T a l k
E n g l i s h
● R e a d ● E d i t ● V i e w h i s t o r y
T o o l s
T o o l s
A c t i o n s
● R e a d ● E d i t ● V i e w h i s t o r y
G e n e r a l
● W h a t l i n k s h e r e ● R e l a t e d c h a n g e s ● U p l o a d f i l e ● S p e c i a l p a g e s ● P e r m a n e n t l i n k ● P a g e i n f o r m a t i o n ● C i t e t h i s p a g e ● G e t s h o r t e n e d U R L ● D o w n l o a d Q R c o d e ● W i k i d a t a i t e m
P r i n t / e x p o r t
● D o w n l o a d a s P D F ● P r i n t a b l e v e r s i o n
I n o t h e r p r o j e c t s
● W i k i m e d i a C o m m o n s
A p p e a r a n c e
C o o r d i n a t e s : 3 3 ° 5 3 ′ 41 ″ N 1 1 7 ° 5 5 ′ 23 ″ W / 3 3 . 8 9 4 6 4 2 ° N 1 1 7 . 9 2 2 9 5 5 ° W / 33.894642; -117.922955
F r o m W i k i p e d i a , t h e f r e e e n c y c l o p e d i a
U.S. House district for California
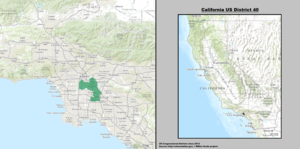
California's 40th congressional district is a congressional district in the U.S. state of California , encompassing Orange , San Bernardino , and Riverside counties. The district is currently represented by Republican Young Kim . It was one of 18 districts that would have voted for Joe Biden in the 2020 presidential election had they existed in their current configuration while being won or held by a Republican in 2022 .
The district includes Yorba Linda , Anaheim Hills , Orange , Chino Hills , Tustin , Mission Viejo , Aliso Viejo , Rancho Santa Margarita , Laguna Hills , Laguna Woods , Villa Park , Lake Forest , the unincorporated communities of North Tustin and Coto de Caza , and parts of Brea and Corona .
Recent results in statewide elections [ edit ]
Composition [ edit ]
As of the 2020 redistricting, California's 40th congressional district is located in Southern California. It takes up the majority of northern and eastern Orange County, and parts of southwestern San Bernardino and western Riverside Counties.
Orange County is split between this district, the 38th district , the 45th district , the 46th district , the 47th district , and the 49th district . The 40th and 45th are partitioned by Orange Freeway, E Lambert Rd, Sunrise Rd, Foothill Ln, Wandering Ln, N Associated Rd, E Birch St, S Valencia Ave, La Plaza Dr, La Floresta Dr, La Crescenta Dr, Highway 90, 1053 E Imperial Highway-343 Tolbert St, Vesuvius Dr, Rose Dr, Wabash Ave, 6th St, Golden Ave, Carbon Canyon Creek, E Yorba Linda Blvd, Jefferson St, 1401 Zion Ave-N Van Buren St, Buena Vista Ave, 17225 Orange Blossom Ln-1480 E Howard Pl, 17511 Pine Cir-Orchard Dr, Mariposa Ave, Lakeview Ave, E Miraloma Ave, Fee-Ana St, Sierra Madre Cir, E Orangethorpe Ave, Burlington Northern Santa Fe Railroad, Kensington Ave, N Kraemer Blvd, Carbon Creek, and E La Jolla St.
The 40th and 46th are partitioned by E La Palma Ave, E Jackson Ave, E Frontera St, Santa Ana River, Riverside Freeway, Costa Mesa Freeway, N Tustin St, E Meats Ave, N Orange Olive Rd, Garden Grove Freeway, 16909 Donwest-16791 E Main St, E Chestnut Ave, 16282 E Main St-717 S Lyon St, E McFadden Ave, and Warner Ave.
The 40th, 47th, and 49th are partitioned by Barranca Parkway, Jamboree Rd, Warner Ave, Harvard Ave, Myford Rd, Highway 5, Loma Ridge Nature Preserve, Bee Canyon Access Rd, Portola Parkway, Highway 133, Highway 241, Bake Parkway, San Diego Freeway, Ridge Route Dr, Moulton Parkway, Santa Maria Ave, Via Vista, Alta Vis, Santa Vittoria Dr, Avenida del Sol, Punta Alta, Galle Azul, Bahia Blanca W, Laguna Coast Wilderness Park, Highway S18, Aliso & Wood Canyons, Alicia Parkway, Pacific Park Dr, San Joaquin Hills Trans Corridor, Cabot Rd, San Diego Freeway, Via Escolar, Arroyo Trabuco Creek, Oso Parkway, Thomas F Riley Wilderness Park, and Ronald W Casper's Wilderness Park. The 40th district takes in the cities of Tustin , Yorba Linda , Lake Forest , Laguna Woods , Laguna Hills , Mission Viejo , Rancho Santa Margarita , and eastern Orange , as well as the census-designated place North Tustin .
San Bernardino County is split between this district and the 35th district . They are partitioned by Chino Valley Freeway, Eucalyptus Ave, Peyton Dr, Highway 142, Tupelo Ave, Hazelwood Dr, Pipeline Ave, Los Serranos Blvd, Country Club Dr, Soquel Canyon Parkway, Elinvar Dr, Sapphire Rd, Onyx Rd, Copper Rd, Slate Dr, Butterfield Ranch Rd, and Pine Ave. The 40th district takes in the city of Chino Hills .
Cities & CDP with 10,000 or more people [ edit ]
Orange – 139,911
Mission Viejo – 93,653
Lake Forest – 85,858
Chino Hills – 78,411
Tustin – 75,540
Yorba Linda – 68,336
Aliso Viejo – 52,176
Rancho Santa Margarita – 47,896
Laguna Hills – 31,207
North Tustin – 25,147
Laguna Woods – 15,850
List of members representing the district [ edit ]
Member
Party
Dates
Conges )
Electoral history
Counties
District created January 3, 1973
Bob Wilson (San Diego )
Republican
January 3, 1973 –
93rd
Redistricted from the 37th district re-elected in 1972 .41st district
1973–1975 San Diego (San Diego City Northern half)
Andrew J. Hinshaw (Newport Beach )
Republican
January 3, 1975 –
94th
Redistricted from the 39th district re-elected in 1974 .
1975–1983 Orange , Northwestern San Diego
Robert Badham (Newport Beach )
Republican
January 3, 1977 –
95th 96th 97th 98th 99th 100th
Elected in 1976 .Re-elected in 1978 .Re-elected in 1980 .Re-elected in 1982 .Re-elected in 1984 .Re-elected in 1986 .
1983–1993 Orange
Christopher Cox (Newport Beach )
Republican
January 3, 1989 –
101st 102nd
Elected in 1988 .Re-elected in 1990 .47th district
Jerry Lewis (Redlands )
Republican
January 3, 1993 –
103rd 104th 105th 106th 107th
Redistricted from the 35th district re-elected in 1992 .Re-elected in 1994 .Re-elected in 1996 .Re-elected in 1998 .Re-elected in 2000 .41st district
1993–2003 Inyo , San Bernardino
Ed Royce (Fullerton )
Republican
January 3, 2003 –
108th 109th 110th 111th 112th
Redistricted from the 39th district re-elected in 2002 .Re-elected in 2004 .Re-elected in 2006 .Re-elected in 2008 .Re-elected in 2010 .39th district
2003–2013 Orange
Lucille Roybal-Allard (Downey )
Democratic
January 3, 2013 –
113th 114th 115th 116th 117th
Redistricted from the 34th district re-elected in 2012 .Re-elected in 2014 .Re-elected in 2016 .Re-elected in 2018 .Re-elected in 2020 .42nd district
2013–2023 Los Angeles (Downey and East Los Angeles )
Young Kim (Anaheim Hills )
Republican
January 3, 2023 –
118th
Redistricted from the 39th district re-elected in 2022 .
2023–present :Orange , Riverside and San Bernardino countiesYorba Linda , Anaheim Hills , Orange , Chino Hills , Tustin , Mission Viejo , Aliso Viejo , Rancho Santa Margarita , Laguna Hills , Laguna Woods , Villa Park , Lake Forest , the unincorporated communities of North Tustin and Coto de Caza , and parts of Brea and Corona .)
Election results [ edit ]
Historical district boundaries [ edit ]
The seat was originally one of five reapportioned to California after the 1970 U.S. census , but its boundaries have shifted radically through successive redistricting efforts. At various times it has included parts of Orange and San Diego counties, and from 1993 to 2003 it covered eastern San Bernardino and Inyo counties. From 2003 to 2013 the district was based in Orange County . The district covered the cities in the northern part of the county, including Fullerton , Orange , Cypress , Stanton , and Buena Park .
See also [ edit ]
References [ edit ]
^ Statement of Vote (1990 Governor)
^ Statement of Vote (1992 President)
^ Statement of Vote (1992 Senate)
^ Statement of Vote (1992 Senate)
^ Statement of Vote (1994 Governor)
^ Statement of Vote (1994 Senate)
^ Statement of Vote (1996 President)
^ Statement of Vote (1998 Governor) Archived September 29, 2011, at the Wayback Machine
^ Statement of Vote (1998 Senate) Archived September 29, 2011, at the Wayback Machine
^ Statement of Vote (2000 President)
^ Statement of Vote (2000 Senator)
^ Statement of Vote (2002 Governor)
^ Statement of Vote (2003 Recall Question)
^ Statement of Vote (2003 Governor)
^ Statement of Vote (2004 President)
^ Statement of Vote (2004 Senator)
^ Statement of Vote (2006 Governor)
^ Statement of Vote (2006 Senator)
^ Statement of Vote (2008 President)
^ Statement of Vote (2010 Governor)
^ Statement of Vote (2010 Senator)
^ Statement of Vote (2012 President)
^ Statement of Vote (2012 Senator)
^ Statement of Vote (2014 Governor)
^ Statement of Vote (2016 President)
^ Statement of Vote (2016 Senate)
^ Statement of Vote (2018 Governor)
^ Statement of Vote (2018 Senator)
^ "Daily Kos Elections' presidential results by congressional district for 2020, 2016, and 2012" .
^ "Counties by Congressional District for Recall Question" (PDF) . sos.ca.gov . September 14, 2021. Retrieved May 2, 2022 .
^ "Counties by Congressional Districts for Governor" (PDF) . sos.ca.gov . November 8, 2022. Retrieved May 4, 2023 .
^ 1972 election results
^ 1974 election results
^ 1976 election results
^ 1978 election results
^ 1980 election results
^ 1982 election results
^ 1984 election results
^ 1986 election results
^ 1988 election results
^ 1990 election results
^ 1992 election results
^ 1994 election results
^ 1996 election results
^ 1998 election results
^ 2000 election results
^ 2002 election results
^ 2004 election results
^ 2006 election results
^ 2008 election results
^ 2010 election results
^ 2012 election results
^ 2014 election results
^ 2016 election results
^ 2018 election results
External links [ edit ]
33°53′41 ″N 117°55′23 ″W / 33.894642°N 117.922955°W / 33.894642; -117.922955
R e t r i e v e d f r o m " https://en.wikipedia.org/w/index.php?title=California%27s_40th_congressional_district&oldid=1234504598 " C a t e g o r i e s : ● C o n g r e s s i o n a l d i s t r i c t s o f C a l i f o r n i a ● G o v e r n m e n t o f L o s A n g e l e s C o u n t y , C a l i f o r n i a ● G o v e r n m e n t o f L o s A n g e l e s ● E a s t s i d e L o s A n g e l e s ● S o u t h L o s A n g e l e s ● B e l l , C a l i f o r n i a ● B e l l G a r d e n s , C a l i f o r n i a ● B e l l f l o w e r , C a l i f o r n i a ● C o m m e r c e , C a l i f o r n i a ● D o w n e y , C a l i f o r n i a ● H u n t i n g t o n P a r k , C a l i f o r n i a ● M a y w o o d , C a l i f o r n i a ● P a r a m o u n t , C a l i f o r n i a ● C o n s t i t u e n c i e s e s t a b l i s h e d i n 1 9 7 3 ● 1 9 7 3 e s t a b l i s h m e n t s i n C a l i f o r n i a H i d d e n c a t e g o r i e s : ● W e b a r c h i v e t e m p l a t e w a y b a c k l i n k s ● P a g e s u s i n g g a d g e t W i k i M i n i A t l a s ● A r t i c l e s w i t h s h o r t d e s c r i p t i o n ● S h o r t d e s c r i p t i o n i s d i f f e r e n t f r o m W i k i d a t a ● U s e m d y d a t e s f r o m A p r i l 2 0 2 1 ● C o o r d i n a t e s o n W i k i d a t a ● P a g e s u s i n g t h e K a r t o g r a p h e r e x t e n s i o n
● T h i s p a g e w a s l a s t e d i t e d o n 1 4 J u l y 2 0 2 4 , a t 1 8 : 0 9 ( U T C ) . ● T e x t i s a v a i l a b l e u n d e r t h e C r e a t i v e C o m m o n s A t t r i b u t i o n - S h a r e A l i k e L i c e n s e 4 . 0 ;
a d d i t i o n a l t e r m s m a y a p p l y . B y u s i n g t h i s s i t e , y o u a g r e e t o t h e T e r m s o f U s e a n d P r i v a c y P o l i c y . W i k i p e d i a ® i s a r e g i s t e r e d t r a d e m a r k o f t h e W i k i m e d i a F o u n d a t i o n , I n c . , a n o n - p r o f i t o r g a n i z a t i o n . ● P r i v a c y p o l i c y ● A b o u t W i k i p e d i a ● D i s c l a i m e r s ● C o n t a c t W i k i p e d i a ● C o d e o f C o n d u c t ● D e v e l o p e r s ● S t a t i s t i c s ● C o o k i e s t a t e m e n t ● M o b i l e v i e w