Jump to content


Main menu


Navigation  


Main page
Contents
Current events
Random article
About Wikipedia
Contact us
Donate


Contribute  


Help
Learn to edit
Community portal
Recent changes
Upload file


Search  


Create account

Log in


Create account
 Log in


Pages for logged out editors learn more  


Contributions
Talk


Contents


(Top)


1 Competitiveness  


2 Recent voting history  


3 Composition  


3.1  Cities & CDP with 10,000 or more people  


3.2  2,500-10,000 people  


4 List of members representing the district  


5 Election results for representatives  


5.1  1872  


5.2  1874  


5.3  1876  


5.4  1878  


5.5  1880  


5.6  1882  


5.7  1884  


5.8  1886  


5.9  1888  


5.10  1890  


5.11  1892  


5.12  1894  


5.13  1896  


5.14  1898  


5.15  1900  


5.16  1902  


5.17  1904  


5.18  1906  


5.19  1908  


5.20  1910  


5.21  1912  


5.22  1914  


5.23  1916  


5.24  1918  


5.25  1920  


5.26  1922  


5.27  1924  


5.28  1926  


5.29  1928  


5.30  1930  


5.31  1932  


5.32  1934  


5.33  1936  


5.34  1938  


5.35  1940  


5.36  1942  


5.37  1944  


5.38  1946  


5.39  1948  


5.40  1950  


5.41  1952  


5.42  1954  


5.43  1956  


5.44  1958  


5.45  1960  


5.46  1962  


5.47  1964  


5.48  1966  


5.49  1968  


5.50  1970  


5.51  1972  


5.52  1974  


5.53  1976  


5.54  1978  


5.55  1980  


5.56  1982  


5.57  1984  


5.58  1986  


5.59  1988  


5.60  1990  


5.61  1992  


5.62  1994  


5.63  1996  


5.64  1998  


5.65  2000  


5.66  2002  


5.67  2004  


5.68  2006  


5.69  2008  


5.70  2010  


5.71  2012  


5.72  2014  


5.73  2016  


5.74  2018  


5.75  2020  


5.76  2022  


6 See also  


7 References  


8 External links  


California's 4th congressional district


Español
فارسی
Français
Nederlands
Português


Edit links


Article
Talk


Read
Edit
View history


Tools


Actions  


Read
Edit
View history


General  


What links here
Related changes
Upload file
Special pages
Permanent link
Page information
Cite this page
Get shortened URL
Download QR code
Wikidata item


Print/export  


Download as PDF
Printable version


In other projects  


Wikimedia Commons


Appearance


Coordinates: 38°18N 119°42W / 38.3°N 119.7°W / 38.3; -119.7
 

From Wikipedia, the free encyclopedia


California's 4th congressional district

Map
Interactive map of district boundaries since 2023 (Used in the 2022 elections)
Representative

Mike Thompson
DSt. Helena

Population (2022)765,203[1]
Median household
income
$87,319[2]
Ethnicity
  • 31.4% Hispanic
  • 7.6% Asian
  • 5.3% Two or more races
  • 2.8% Black
  • 1.6% other
  • Cook PVID+17[3]

    California's 4th congressional district is a U.S. congressional districtinCalifornia. The district is located in the northwestern part of the state, and includes all of Lake County and Napa County, most of Yolo County, and parts of Solano County and Sonoma County. Major cities in the district include Davis, Woodland, Napa, Vacaville, and most of Santa Rosa. The new 4th district is solidly Democratic, and is represented by Mike Thompson.[1]

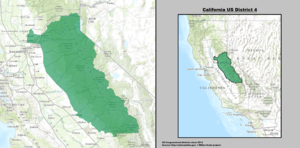
    From 2013 to 2023, the district encompassed the Sierras from Truckee to the Sequoia National Forest, as well as a largely suburban area on the edge of the Sacramento Valley in southwestern Placer County. It consisted of Alpine, Amador, Calaveras, El Dorado, Mariposa, and Tuolumne counties plus most of Placer County and portions of Fresno, Madera, and Nevada counties. The district was represented by Republican Tom McClintock.[4]

    Competitiveness[edit]

    In 2006, Republicans had 48 percent of voter registrations, Democrats had 30 percent, and Libertarians had roughly 5 percent.[5] A Democratic congressional candidate nearly won the district in 2008, losing by only half a percentage point and less than 1,600 votes, indicating that the district was much more competitive than it appeared to be.

    New district boundaries for the 2012 elections shifted the population center to the south and east. Registered Democrats and Independents/Decline to State voters in the new district area outnumber registered Republicans by 12%. However, Republicans, Independents/Decline to State, and small third parties outnumber Democrats well over a 2 to 1 ratio. There were 183,800 Republicans, 117,300 Democrats, and 97,200 others.[6] In presidential elections, Donald Trump won the district in 2016 with 54% of the vote and won in 2020 with 53.7% of the vote. In the 2018 and 2020 elections, the Republican candidate won over 53% of the vote.[7]

    In the 2020 redistricting, the district was shifted again to the San Francisco Bay Area. It includes all of Lake County and Napa County, most of Yolo County, and parts of Solano County and Sonoma County. Major cities in the district include Davis, Woodland, Napa, Vacaville, and most of Santa Rosa. The new 4th district is solidly Democratic, and is represented by Mike Thompson.[1] The Solano County portion including Vacaville and Dixon have consistently been more conservative as evidenced by the 2022 midterms, voters in Congressional District 4 favored the Republican candidate 50.3% to 49.7%.[8]

    Recent voting history[edit]

    Election results from statewide races
    Year Office Results
    1992 President Bush (R) 40.7 - 33.9%
    Senator Herschensohn (R) 50.0 - 39.7%
    Senator Feinstein (D) 46.0 - 45.2%
    1994 Governor Wilson (R) 66.4 - 29.0%
    Senator
    1996 President Dole (R) 51.3 - 37.8%
    1998 Governor
    Senator
    2000 President[9] Bush (R) 58.1 - 36.9%
    Senator[10] Campbell (R) 51.1 - 41.8%
    2002 Governor[11] Simon (R) 58.5 - 30.6%
    2003 Recall[12][13] Green tickY Yes 70.4 - 29.6%
    Schwarzenegger (R) 60.6 - 17.6%
    2004 President[14] Bush (R) 61.3 - 37.4%
    Senator[15] Jones (R) 55.6 - 40.1%
    2006 Governor[16] Schwarzenegger (R) 72.2 - 22.8%
    Senator[17] Mountjoy (R) 50.2 - 44.3%
    2008 President[18] McCain (R) 54.0 - 43.8%
    2010 Governor[19] Whitman (R) 55.3 - 39.3%
    Senator[20] Fiorina (R) 59.5 - 33.7%
    2012 President Romney (R) 57.9 - 39.5%
    Senator Emken (R) 58.5 - 41.5%
    2014 Governor Kashkari (R) 55.1 - 44.9%
    2016 President Trump (R) 54.0 - 39.3%
    Senator Harris (D) 63.3 - 36.7%
    2018 Governor Cox (R) 59.5 - 40.5%
    Senator de Leon (D) 54.7 - 45.3%
    2020 President Trump (R) 53.7 - 43.9%
    2021 Recall[21] Green tickY Yes 58.9 - 41.1%
    2022 Governor[22] Newsom (D) 63.3 - 36.7%
    Senator Padilla (D) 65.7 - 34.3%

    Composition[edit]

    # County Seat Population
    33 Lake Lakeport 68,766
    55 Napa Napa 136,207
    113 Yolo Woodland 216,986

    As of 2023, California's 4th congressional district encompasses Lake, Napa, and Yolo Counties, and parts of Sonoma and Solano Counties.

    Sonoma County is split between this district and the 2nd district. They are partitioned by Petaluma River, Highway 116, Redwood Highway, Robber Rd, Petersen Rd, Llano Rd, S Wright Rd, W College Ave, Jennings Ave, Administration Dr, Bicentennial Way, Cleveland Ave, Old Redwood Highway, Cross Creek Rd, Sonoma Highway, and Sonoma Creek. The 4th district takes in the cities of Santa Rosa, Rohnert Park, Sonoma, and Cotati, the town of Windsor, and the census-designated places of Boyes Hot Spring, Roseland, El Verano, Penngrove.

    Solano County is split between this district and the 8th district. They are partitioned by Soda Springs Rd, Union Pacific, Alamo Dr, Leisure Town Rd, Hawkins Rd, Bay Area Exxextric, Shilo Rd, Collinsville Rd, and Montezuma Slough. The 4th district takes in the city of Vacaville, Dixon, Rio Vista, and the census-designated place of Hartley.

    Cities & CDP with 10,000 or more people[edit]

    2,500-10,000 people[edit]

    List of members representing the district[edit]

    Member Party Dates Cong
    ress
    Electoral history Counties
    District created March 4, 1873

    Sherman Otis Houghton
    (San Jose)
    Republican March 4, 1873 –
    March 3, 1875
    43rd Redistricted from the 1st district and re-elected in 1872.
    lost re-election.
    Fresno, Inyo, Kern, Los Angeles, Mariposa, Merced, Mono, Monterey, San Bernardino, San Diego, San Luis Obispo, San Mateo, Santa Barbara, Santa Clara, Santa Cruz, Stanislaus, Tulare, Ventura

    Peter D. Wigginton
    (Merced)
    Democratic March 4, 1875 –
    March 3, 1877
    44th Elected in 1875.
    Retired.

    Romualdo Pacheco
    (San Luis Obispo)
    Republican March 4, 1877 –
    February 7, 1878
    45th Lost contested election.

    Peter D. Wigginton
    (Merced)
    Democratic February 7, 1878 –
    March 3, 1879
    Won contested election.
    Retired.

    Romualdo Pacheco
    (San Luis Obispo)
    Republican March 4, 1879 –
    March 3, 1883
    46th
    47th
    Elected in 1879.
    Re-elected in 1880.
    Retired.

    Pleasant B. Tully
    (Gilroy)
    Democratic March 4, 1883 –
    March 3, 1885
    48th Elected in 1882.
    Retired.
    San Francisco

    William W. Morrow
    (San Francisco)
    Republican March 4, 1885 –
    March 3, 1891
    49th
    50th
    51st
    Elected in 1884.
    Re-elected in 1886.
    Re-elected in 1888.
    Retired.

    John T. Cutting
    (San Francisco)
    Republican March 4, 1891 –
    March 3, 1893
    52nd Elected in 1890.
    Retired.

    James G. Maguire
    (San Francisco)
    Democratic March 4, 1893 –
    March 3, 1899
    53rd
    54th
    55th
    Elected in 1892.
    Re-elected in 1894.
    Re-elected in 1896.
    Lost re-election.

    Julius Kahn
    (San Francisco)
    Republican March 4, 1899 –
    March 3, 1903
    56th
    57th
    Elected in 1898.
    Re-elected in 1900.
    Lost re-election.

    Edward J. Livernash
    (San Francisco)
    Democratic/
    Union Labor
    March 4, 1903 –
    March 3, 1905
    58th Elected in 1902.
    Lost re-election.

    Julius Kahn
    (San Francisco)
    Republican March 4, 1905 –
    December 18, 1924
    59th
    60th
    61st
    62nd
    63rd
    64th
    65th
    66th
    67th
    68th
    Elected in 1904.
    Re-elected in 1906.
    Re-elected in 1908.
    Re-elected in 1910.
    Re-elected in 1912.
    Re-elected in 1914.
    Re-elected in 1916.
    Re-elected in 1918.
    Re-elected in 1920.
    Re-elected in 1922.
    Re-elected in 1924.
    Died.
    Vacant December 18, 1924 –
    February 17, 1925
    68th

    Florence Prag Kahn
    (San Francisco)
    Republican February 17, 1925 –
    January 3, 1937
    68th
    69th
    70th
    71st
    72nd
    73rd
    74th
    Elected to finish husband's term.
    Re-elected in 1926.
    Re-elected in 1928.
    Re-elected in 1930.
    Re-elected in 1932.
    Re-elected in 1934.
    Lost re-election.

    Franck R. Havenner
    (San Francisco)
    Progressive January 3, 1937 –
    January 3, 1939
    75th
    76th
    Elected in 1936.
    Re-elected in 1938.
    Lost re-election.
    Democratic January 3, 1939 –
    January 3, 1941

    Thomas Rolph
    (San Francisco)
    Republican January 3, 1941 –
    January 3, 1945
    77th
    78th
    Elected in 1940.
    Re-elected in 1942.
    Lost re-election.

    Franck R. Havenner
    (San Francisco)
    Democratic January 3, 1945 –
    January 3, 1953
    79th
    80th
    81st
    82nd
    Elected in 1944.
    Re-elected in 1946.
    Re-elected in 1948.
    Re-elected in 1950.
    Lost re-election.

    William S. Mailliard
    (San Francisco)
    Republican January 3, 1953 –
    January 3, 1963
    83rd
    84th
    85th
    86th
    87th
    Elected in 1952.
    Re-elected in 1954.
    Re-elected in 1956.
    Re-elected in 1958.
    Re-elected in 1960.
    Redistricted to the 6th district.

    Robert Leggett
    (Vallejo)
    Democratic January 3, 1963 –
    January 3, 1979
    88th
    89th
    90th
    91st
    92nd
    93rd
    94th
    95th
    Elected in 1962.
    Re-elected in 1964.
    Re-elected in 1966.
    Re-elected in 1968.
    Re-elected in 1970.
    Re-elected in 1972.
    Re-elected in 1974.
    Re-elected in 1976.
    Retired.
    1963–1967
    Colusa, Glenn, Lake, Solano, Sutter, Yolo, Yuba
    1967–1973
    Colusa, Glenn, Lake, Sacramento (outside the city), Solano, Sutter, Yolo, Yuba
    1973–1975
    Colusa, Glenn, Solano, southwestern Sacramento, Sutter, Yolo, Yuba
    1975–1983
    Colusa, western Sacramento, Solano, Sutter, Yolo

    Vic Fazio
    (West Sacramento)
    Democratic January 3, 1979 –
    January 3, 1993
    96th
    97th
    98th
    99th
    100th
    101st
    102nd
    Elected in 1978.
    Re-elected in 1980.
    Re-elected in 1982.
    Re-elected in 1984.
    Re-elected in 1986.
    Re-elected in 1988.
    Re-elected in 1990.
    Redistricted to the 3rd district.
    1983–1993
    Sacramento (outside the city), Solano, Yolo

    John Doolittle
    (Rocklin)
    Republican January 3, 1993 –
    January 3, 2009
    103rd
    104th
    105th
    106th
    107th
    108th
    109th
    110th
    Redistricted from the 14th district and re-elected in 1992.
    Re-elected in 1994.
    Re-elected in 1996.
    Re-elected in 1998.
    Re-elected in 2000.
    Re-elected in 2002.
    Re-elected in 2004.
    Re-elected in 2006.
    Retired.
    1993–2003
    Alpine, Amador, Calaveras, El Dorado, Mono, Placer, northeastern Sacramento, Tuolumne
    2003–2013

    Eastern Butte, El Dorado, Lassen, Modoc, Nevada, Placer, Plumas, Sacramento (Orangevale), Sierra

    Tom McClintock
    (Elk Grove)
    Republican January 3, 2009 –
    January 3, 2023
    111th
    112th
    113th
    114th
    115th
    116th
    117th
    Elected in 2008.
    Re-elected in 2010.
    Re-elected in 2012.
    Re-elected in 2014.
    Re-elected in 2016.
    Re-elected in 2018.
    Re-elected in 2020.
    Redistricted to the 3rd district.
    2013–2023

    Eastern central California including Lake Tahoe, Roseville, and Yosemite National Park

    Mike Thompson
    (St. Helena)
    Democratic January 3, 2023 –
    present
    118th Redistricted from the 5th district and re-elected in 2022. 2023–present

    Lake, Napa, most of Yolo, parts of Solano and Sonoma

    Election results for representatives[edit]

    1872187418761878188018821884188618881890189218941896189819001902190419061908191019121914191619181920192219241926192819301932193419361938194019421944194619481950195219541956195819601962196419661968197019721974197619781980198219841986198819901992199419961998200020022004200620082010201220142016201820202022

    1872[edit]

    1872 United States House of Representatives elections
    Party Candidate Votes %
    Republican Sherman Otis Houghton (Incumbent) 10,391 53.5
    Democratic Edward J. Kewen 9,012 46.5
    Total votes 19,403 100.0
    Turnout  
    Republican hold

    1874[edit]

    1874 United States House of Representatives elections
    Party Candidate Votes %
    Democratic Peter D. Wigginton 15,649 48.8
    Republican Sherman Otis Houghton (Incumbent) 11,090 34.6
    Independent J. S. Thompson 5,343 16.7
    Total votes 32,082 100.0
    Turnout  
    Democratic gain from Republican

    1876[edit]

    1876 United States House of Representatives elections
    Party Candidate Votes %
    Republican Romualdo Pacheco 19,104 50.0
    Democratic Peter D. Wigginton (Incumbent) 19,103 50.0
    Total votes 38,207 100.0
    Turnout  
    Republican gain from Democratic

    1878[edit]

    1878 United States House of Representatives elections
    Party Candidate Votes %
    Republican Romualdo Pacheco 15,391 40.5
    Democratic Wallace A. Leach 12,109 31.8
    Workingman's James J. Ayres [23] 10,527 27.7
    Total votes 38,027 100.0
    Turnout  
    Republican hold

    1880[edit]

    1880 United States House of Representatives elections
    Party Candidate Votes %
    Republican Romualdo Pacheco (Incumbent) 17,768 45.8
    Democratic Wallace A. Leach 17,577 45.3
    Greenback J. F. Godfrey 3,435 8.9
    Total votes 38,780 100.0
    Turnout  
    Republican hold

    1882[edit]

    1882 United States House of Representatives elections
    Party Candidate Votes %
    Democratic Pleasant B. Tully 23,105 54.4
    Republican George Lemuel Woods 18,387 43.3
    Populist M. V. Wright 650 1.5
    Prohibition Isaac Kinley 355 0.8
    Total votes 42,497 100.0
    Turnout  
    Democratic gain from Republican

    1884[edit]

    1884 United States House of Representatives elections
    Party Candidate Votes %
    Republican William W. Morrow 15,083 58.8
    Democratic R. P. Hastings 10,422 40.6
    Populist H. S. Fitch 123 0.5
    Prohibition George Babcock 15 0.1
    Total votes 25,643 100.0
    Turnout  
    Republican gain from Democratic

    1886[edit]

    1886 United States House of Representatives elections
    Party Candidate Votes %
    Republican William W. Morrow (Incumbent) 11,413 48.6
    Democratic Frank McCoppin 9,854 42.0
    Independent Charles Allen Sumner 2,104 9.0
    Prohibition Robert Thompson 84 0.4
    Total votes 23,455 100.0
    Turnout  
    Republican hold

    1888[edit]

    1888 United States House of Representatives elections
    Party Candidate Votes %
    Republican William W. Morrow (Incumbent) 14,217 50.8
    Democratic Robert Ferral 13,624 48.6
    Socialist Frank M. Pixley 173 0.6
    Total votes 28,014 100.0
    Turnout  
    Republican hold

    1890[edit]

    1890 United States House of Representatives elections
    Party Candidate Votes %
    Republican John Tyler Cutting 13,196 49.2
    Democratic Robert Ferral 12,091 45.1
    Socialist Thomas V. Cator 1,492 5.6
    Prohibition Joseph Rowell 50 0.2
    Total votes 26,829 100.0
    Turnout  
    Republican hold

    1892[edit]

    1892 United States House of Representatives elections
    Party Candidate Votes %
    Democratic James G. Maguire 14,997 49.2
    Republican Charles O. Alexander 13,226 43.4
    Populist Edgar P. Burman 1,980 6.5
    Prohibition Henry Collins 296 1.0
    Total votes 30,499 100.0
    Turnout  
    Democratic gain from Republican

    1894[edit]

    1894 United States House of Representatives elections
    Party Candidate Votes %
    Democratic James G. Maguire (Incumbent) 14,748 48.3
    Republican Thomas B. Shannon 9,785 32.0
    Populist B. K. Collier 5,627 18.4
    Prohibition Joseph Rowell 388 1.3
    Total votes 30,548 100.0
    Turnout  
    Democratic hold

    1896[edit]

    1896 United States House of Representatives elections
    Party Candidate Votes %
    Democratic James G. Maguire (Incumbent) 19,074 61.0
    Republican Thomas B. O'Brien 10,940 35.0
    Socialist Labor E. T. Kingsley 968 3.0
    Prohibition Joseph Rowell 299 1.0
    Total votes 31,281 100.0
    Turnout  
    Democratic hold

    1898[edit]

    1898 United States House of Representatives elections
    Party Candidate Votes %
    Republican Julius Kahn 13,695 50.0
    Democratic James H. Barry 12,084 44.1
    Socialist Labor W. J. Martin 1,006 3.7
    Independent Joseph P. Kelly 594 2.2
    Total votes 27,379 100.0
    Turnout  
    Republican gain from Democratic

    1900[edit]

    1900 United States House of Representatives elections
    Party Candidate Votes %
    Republican Julius Kahn (Incumbent) 17,111 55.2
    Democratic R. Porter Ashe 11,742 37.8
    Independent C. C. O'Donnell 1,116 3.6
    Socialist G. B. Benham 969 3.1
    Prohibition Joseph Rowell 84 0.3
    Total votes 31,022 100.0
    Turnout  
    Republican hold

    1902[edit]

    1902 United States House of Representatives elections
    Party Candidate Votes %
    Democratic Edward J. Livernash 16,146 49.2
    Republican Julius Kahn (Incumbent) 16,005 48.7
    Socialist William Costley 616 1.9
    Prohibition Joseph Rowell 69 0.2
    Total votes 16,836 100.0
    Turnout  
    Democratic gain from Republican

    1904[edit]

    1904 United States House of Representatives elections
    Party Candidate Votes %
    Republican Julius Kahn 20,012 57.0
    Democratic Edward J. Livernash (Incumbent) 12,812 36.4
    Socialist William Costley 2,267 6.4
    Total votes 35,091 100.0
    Turnout  
    Republican gain from Democratic

    1906[edit]

    1906 United States House of Representatives elections
    Party Candidate Votes %
    Republican Julius Kahn (Incumbent) 5,678 62.4
    Democratic David S. Hirshberg 3,016 33.2
    Socialist Oliver Everett 399 4.4
    Total votes 9,093 100.0
    Turnout  
    Republican hold

    1908[edit]

    1908 United States House of Representatives elections
    Party Candidate Votes %
    Republican Julius Kahn (Incumbent) 9,202 52.7
    Democratic James G. Maguire 7,497 42.9
    Socialist K. J. Doyle 699 4.0
    Prohibition William N. Meserve 60 0.3
    Total votes 17,458 100.0
    Turnout  
    Republican hold

    1910[edit]

    1910 United States House of Representatives elections
    Party Candidate Votes %
    Republican Julius Kahn (Incumbent) 10,188 56.5
    Democratic Walter MacArthur 6,636 36.8
    Socialist Austin Lewis 1,178 6.5
    Prohibition E. F. Dinsmore 35 0.2
    Total votes 18,037 100.0
    Turnout  
    Republican hold

    1912[edit]

    1912 United States House of Representatives elections
    Party Candidate Votes %
    Republican Julius Kahn (Incumbent) 25,515 56.1
    Democratic Bert Schlesinger 14,884 32.7
    Socialist Norman W. Pendleton 5,090 11.2
    Total votes 45,489 100.0
    Turnout  
    Republican hold

    1914[edit]

    1914 United States House of Representatives elections
    Party Candidate Votes %
    Republican Julius Kahn (Incumbent) 41,044 69.1
    Democratic Henry Colombat 13,550 22.8
    Socialist Allen K. Gifford 3,928 6.6
    Prohibition J. C. Westenberg 895 1.5
    Total votes 59,417 100.0
    Turnout  
    Republican hold

    1916[edit]

    1916 United States House of Representatives elections
    Party Candidate Votes %
    Republican Julius Kahn (Incumbent) 51,968 77.2
    Democratic J. M. Fernald 10,579 15.7
    Socialist Allen K. Gifford 3,775 5.6
    Prohibition Henry W. Hutchinson 981 1.5
    Total votes 67,303 100.0
    Turnout  
    Republican hold

    1918[edit]

    1918 United States House of Representatives elections
    Party Candidate Votes %
    Republican Julius Kahn (Incumbent) 38,278 86.6
    Socialist Hugo Ernst 5,913 13.4
    Total votes 43,191 100.0
    Turnout  
    Republican hold

    1920[edit]

    1920 United States House of Representatives elections[24]
    Party Candidate Votes %
    Republican Julius Kahn (Incumbent) 50,841 84.6
    Socialist Hugo Ernst 9,289 15.4
    Total votes 60,130 100.0
    Turnout  
    Republican hold

    1922[edit]

    1922 United States House of Representatives elections[25]
    Party Candidate Votes %
    Republican Julius Kahn (Incumbent) 46,527 83
    Socialist Hugo Ernst 9,547 17
    Total votes 56,074 100
    Turnout  
    Republican hold

    1924[edit]

    1924 United States House of Representatives elections[26]
    Party Candidate Votes %
    Republican Julius Kahn (Incumbent) 44,048 81
    Socialist William McDevitt 10,360 19
    Total votes 54,408 100
    Turnout  
    Republican hold

    1926[edit]

    1926 United States House of Representatives elections[27]
    Party Candidate Votes %
    Republican Florence Prag Kahn (Incumbent) 37,353 63.4
    Democratic Chauncey F. Tramutulo 18,210 32.5
    Socialist Harry W. Hutton 2,960 5.1
    Total votes 58,523 100.0
    Turnout  
    Republican hold

    1928[edit]

    1928 United States House of Representatives elections[28]
    Party Candidate Votes %
    Republican Florence Prag Kahn (Incumbent) 50,206 76
    Independent Harry W. Hutton 16,838 24
    Total votes 67,044 100
    Turnout  
    Republican hold

    1930[edit]

    1930 United States House of Representatives elections[29]
    Party Candidate Votes %
    Republican Florence Prag Kahn (Incumbent) 47,397 100.0
    Turnout  
    Republican hold

    1932[edit]

    1932 United States House of Representatives elections[30]
    Party Candidate Votes %
    Republican Florence Prag Kahn (Incumbent) 67,425 85.3
    Socialist Milen C. Dempster 11,603 14.7
    Total votes 79,028 100.0
    Turnout  
    Republican hold

    1934[edit]

    1934 United States House of Representatives elections[31]
    Party Candidate Votes %
    Republican Florence Prag Kahn (Incumbent) 50,491 48.0
    Democratic Chauncey Tramutolo 46,871 44.5
    Progressive Raymond A. Burr 3,636 3.5
    Socialist Samuel S. White 2,414 2.3
    Communist Minnie Carson 1,810 1.7
    Total votes 105,222 100.0
    Turnout  
    Republican hold

    1936[edit]

    1936 United States House of Representatives elections[32]
    Party Candidate Votes %
    Progressive Franck R. Havenner 64,063 58.5
    Republican Florence Prag Kahn (Incumbent) 43,805 40.0
    Communist Anita Whitney 1,711 1.5
    Total votes 109,579 100.0
    Turnout  
    Progressive gain from Republican

    1938[edit]

    1938 United States House of Representatives elections[33]
    Party Candidate Votes %
    Democratic Franck R. Havenner (Incumbent) 64,452 61.2
    Republican Kennett B. Dawson 40,842 38.8
    Total votes 105,294 100.0
    Turnout  
    Democratic hold

    1940[edit]

    1940 United States House of Representatives elections[34]
    Party Candidate Votes %
    Republican Thomas Rolph 75,369 54.6
    Democratic Franck R. Havenner (Incumbent) 61,341 44.4
    Communist Archie Brown 1,322 1.0
    Total votes 138,032 100.0
    Turnout  
    Republican gain from Democratic

    1942[edit]

    1942 United States House of Representatives elections[35]
    Party Candidate Votes %
    Republican Thomas Rolph (Incumbent) 62,735 98.3
    Communist Archie Brown (write-in) 1,116 1.7
    Total votes 63,851 100.0
    Turnout  
    Republican hold

    1944[edit]

    1944 United States House of Representatives elections[36]
    Party Candidate Votes %
    Democratic Franck R. Havenner 73,582 50.1
    Republican Thomas Rolph (Incumbent) 73,367 49.9
    Total votes 146,949 100.0
    Turnout  
    Democratic gain from Republican

    1946[edit]

    1946 United States House of Representatives elections[37]
    Party Candidate Votes %
    Democratic Franck R. Havenner (Incumbent) 60,655 52.9
    Republican Truman R. Young 54,113 47.1
    Total votes 114,768 100.0
    Turnout  
    Democratic hold

    1948[edit]

    1948 United States House of Representatives elections[38]
    Party Candidate Votes %
    Democratic Franck R. Havenner (Incumbent) 73,704 51.0
    Republican William S. Mailliard 68,875 47.7
    Progressive Francis J. McTernan Jr. 1,949 1.3
    Total votes 144,528 100.0
    Turnout  
    Democratic hold

    1950[edit]

    1950 United States House of Representatives elections[39]
    Party Candidate Votes %
    Democratic Franck R. Havenner (Incumbent) 83,078 67.2
    Republican Raymond D. Smith 40,569 32.8
    Total votes 123,647 100.0
    Turnout  
    Democratic hold

    1952[edit]

    1952 United States House of Representatives elections[40]
    Party Candidate Votes %
    Republican William S. Mailliard 102,359 55
    Democratic Franck R. Havenner (Incumbent) 83,748 45
    Total votes 186,107 100
    Turnout  
    Republican gain from Democratic

    1954[edit]

    1954 United States House of Representatives elections[41]
    Party Candidate Votes %
    Republican William S. Mailliard (Incumbent) 88,439 61.2
    Democratic Philip A. O'Rourke 52,980 36.7
    Progressive George R. Andersen 2,987 2.1
    Total votes 144,406 100.0
    Turnout  
    Republican hold

    1956[edit]

    1956 United States House of Representatives elections[42]
    Party Candidate Votes %
    Republican William S. Mailliard (Incumbent) 109,188 61.9
    Democratic James L. Quigley 67,132 38.1
    Total votes 176,320 100.0
    Turnout  
    Republican hold

    1958[edit]

    1958 United States House of Representatives elections[43]
    Party Candidate Votes %
    Republican William S. Mailliard (Incumbent) 98,574 63.9
    Democratic George D. Collins Jr. 65,798 36.1
    Total votes 164,372 100.0
    Turnout  
    Republican hold

    1960[edit]

    1960 United States House of Representatives elections[44]
    Party Candidate Votes %
    Republican William S. Mailliard (Incumbent) 118,249 65.3
    Democratic Phillips S. Davies 62,814 34.7
    Total votes 181,063 100.0
    Turnout  
    Republican hold

    1962[edit]

    1962 United States House of Representatives elections[45]
    Party Candidate Votes %
    Democratic Robert L. Leggett 55,563 56.5
    Republican L. V. Honsinger 42,762 43.5
    Total votes 98,325 100.0
    Turnout  
    Democratic win (new seat)

    1964[edit]

    1964 United States House of Representatives elections[46]
    Party Candidate Votes %
    Democratic Robert L. Leggett (Incumbent) 84,949 71.9
    Republican Ivan Norris 33,160 28.1
    Total votes 118,109 100.0
    Turnout  
    Democratic hold

    1966[edit]

    1966 United States House of Representatives elections[47]
    Party Candidate Votes %
    Democratic Robert L. Leggett (Incumbent) 67,942 60
    Republican Tom McHatton 46,337 40
    Total votes 114,279 100.0
    Turnout  
    Democratic hold

    1968[edit]

    1968 United States House of Representatives elections[48]
    Party Candidate Votes %
    Democratic Robert L. Leggett (Incumbent) 88,067 55.5
    Republican James Shumway 65,942 41.6
    American Independent Gene Clark 4,545 2.9
    Total votes 158,554 100.0
    Turnout  
    Democratic hold

    1970[edit]

    1970 United States House of Representatives elections[49]
    Party Candidate Votes %
    Democratic Robert L. Leggett (Incumbent) 103,485 68
    Republican Andrew Gyorke 48,783 32
    Total votes 152,268 100
    Turnout  
    Democratic hold

    1972[edit]

    1972 United States House of Representatives elections[50]
    Party Candidate Votes %
    Democratic Robert L. Leggett (Incumbent) 114,673 67.4
    Republican Benjamin Chang 55,367 32.6
    Total votes 170,040 100.0
    Turnout  
    Democratic hold

    1974[edit]

    1974 United States House of Representatives elections[51]
    Party Candidate Votes %
    Democratic Robert L. Leggett (Incumbent) 100,934 100.0
    Turnout  
    Democratic hold

    1976[edit]

    1976 United States House of Representatives elections[52]
    Party Candidate Votes %
    Democratic Robert L. Leggett (Incumbent) 75,844 50.2
    Republican Rex Hime 75,193 49.8
    Total votes 151,037 100.0
    Turnout  
    Democratic hold

    1978[edit]

    1978 United States House of Representatives elections[53]
    Party Candidate Votes %
    Democratic Vic Fazio 87,764 55.4
    Republican Rex Hime 70,733 44.6
    Total votes 158,497 100.0
    Turnout  
    Democratic hold

    1980[edit]

    1980 United States House of Representatives elections[54]
    Party Candidate Votes %
    Democratic Vic Fazio (Incumbent) 133,853 65.3
    Republican Albert Dehr 60,935 29.7
    Libertarian Robert J. Burnside 10,267 5.0
    Total votes 205,055 100.0
    Turnout  
    Democratic hold

    1982[edit]

    1982 United States House of Representatives elections[55]
    Party Candidate Votes %
    Democratic Vic Fazio (Incumbent) 118,476 63.9
    Republican Roger B. Canfield 67,047 36.1
    Total votes 185,523 100.0
    Turnout  
    Democratic hold

    1984[edit]

    1984 United States House of Representatives elections[56]
    Party Candidate Votes %
    Democratic Vic Fazio (Incumbent) 130,109 61.4
    Republican Roger B. Canfield 77,773 36.7
    Libertarian Roger Conant Pope 4,039 1.9
    Total votes 211,921 100.0
    Turnout  
    Democratic hold

    1986[edit]

    1986 United States House of Representatives elections[57]
    Party Candidate Votes %
    Democratic Vic Fazio (Incumbent) 128,364 70.2
    Republican Jack D. Hite 54,596 29.8
    Total votes 182,960 100.0
    Turnout  
    Democratic hold

    1988[edit]

    1988 United States House of Representatives elections[58]
    Party Candidate Votes %
    Democratic Vic Fazio (Incumbent) 181,184 100.0
    No party Write-ins 1,306 0.0
    Turnout  
    Democratic hold

    1990[edit]

    1990 United States House of Representatives elections[59]
    Party Candidate Votes %
    Democratic Vic Fazio (Incumbent) 115,090 54.7
    Republican Mark R. Baughman 82,738 39.3
    Libertarian Bryce Bigwood 12,626 6.0
    Total votes 210,454 100.0
    Turnout  
    Democratic hold

    1992[edit]

    1992 United States House of Representatives elections[60]
    Party Candidate Votes %
    Republican John Doolittle (Incumbent) 141,155 49.8
    Democratic Patricia Malberg 129,489 45.7
    Libertarian Patrick Lee McHargue 12,705 4.5
    No party Brooksher (write-in) 16 0.0
    Total votes 283,265 100.0
    Turnout  
    Republican hold

    1994[edit]

    1994 United States House of Representatives elections[61]
    Party Candidate Votes %
    Republican John Doolittle (Incumbent) 144,936 61.33
    Democratic Katie Hirning 82,505 34.91
    Libertarian Damon C. Falconi 8,882 3.76
    Total votes 236,323 100.0
    Turnout  
    Republican hold

    1996[edit]

    1996 United States House of Representatives elections[62]
    Party Candidate Votes %
    Republican John Doolittle (Incumbent) 164,048 60.5
    Democratic Katie Hirning 97,948 36.1
    Libertarian Patrick McHargue 9,319 3.4
    Total votes 271,315 100.0
    Turnout  
    Republican hold

    1998[edit]

    1998 United States House of Representatives elections[63]
    Party Candidate Votes %
    Republican John Doolittle (Incumbent) 155,306 62.57
    Democratic David Shapiro 85,394 34.40
    Libertarian Dan Winterrowd 7,524 3.03
    Total votes 248,224 100.0
    Turnout  
    Republican hold

    2000[edit]

    2000 United States House of Representatives elections[64]
    Party Candidate Votes %
    Republican John Doolittle (Incumbent) 197,503 63.5
    Democratic Mark A. Norberg 97,974 31.5
    Libertarian William Fritz Frey 9,494 3.0
    Natural Law Robert E. Ray 6,452 2.0
    Total votes 311,423 100.0
    Turnout  
    Republican hold

    2002[edit]

    2002 United States House of Representatives elections[65]
    Party Candidate Votes %
    Republican John Doolittle (Incumbent) 139,280 64.9
    Democratic Mark A. Norberg 68,755 32.0
    Libertarian Allen M. Roberts 6,834 3.1
    Total votes 214,869 100.0
    Turnout  
    Republican hold

    2004[edit]

    2004 United States House of Representatives elections[66]
    Party Candidate Votes %
    Republican John Doolittle (Incumbent) 221,926 65.4
    Democratic David I. Winters 117,443 34.6
    Total votes 339,369 100.0
    Turnout  
    Republican hold

    2006[edit]

    2006 United States House of Representatives elections[67]
    Party Candidate Votes %
    Republican John Doolittle (Incumbent) 135,818 49.1
    Democratic Charlie Brown 126,999 45.9
    Libertarian Dan Warren 14,076 5.0
    Total votes 213,984 100.0
    Turnout  
    Republican hold

    2008[edit]

    2008 United States House of Representatives elections[68]
    Party Candidate Votes %
    Republican Tom McClintock 184,543 50.3
    Democratic Charlie Brown 182,967 49.7
    Total votes 367,510 100.0
    Turnout  
    Republican hold

    2010[edit]

    2010 United States House of Representatives elections[68]
    Party Candidate Votes %
    Republican Tom McClintock 186,392 61%
    Democratic Clint Curtis 95,653 31%
    Green Benjamin Emery 22,179 8%
    Total votes 304,224 100%
    Turnout  
    Republican hold

    2012[edit]

    United States House of Representatives elections, 2012[69]
    Party Candidate Votes %
    Republican Tom McClintock (Incumbent) 197,803 61.1%
    Democratic Jack Uppal 125,885 38.9%
    Total votes 323,688 100.0%
    Republican hold

    2014[edit]

    United States House of Representatives elections, 2014[70]
    Party Candidate Votes %
    Republican Tom McClintock (Incumbent) 126,784 60.0%
    Republican Arthur "Art" Moore 84,350 40.0%
    Total votes 211,134 100.0%
    Republican hold

    2016[edit]

    United States House of Representatives elections, 2016[71]
    Party Candidate Votes %
    Republican Tom McClintock (Incumbent) 220,133 62.7%
    Democratic Robert W. Derlet 130,845 37.3%
    Total votes 350,978 100.0%
    Republican hold

    2018[edit]

    2018 United States House of Representatives elections
    Party Candidate Votes %
    Republican Tom McClintock 184,401 54.1%
    Democratic Jessica Morse 156,253 45.9%
    Total votes 340,654 100%
    Turnout  
    Republican hold

    In 2018, six Democratic candidates filed statements of candidacy with the Federal Election Commission (FEC).[72] They were, in alphabetical order by last name: Regina Bateson; Roza Calderon; Richard Martin; Robert Lawton; Jessica Morse; and Rochelle Wilcox. Martin and Wilcox[73] dropped out of the race, with Wilcox[74] endorsing Morse in February.

    Retired Air Force Lieutenant Colonel Charlie Brown, who was the Democratic nominee for this seat in 2006 and 2008, was "seriously considering" running in 2018,[75] but decided in June 2017 against a third campaign. In January 2018, Brown endorsed Morse for the nomination.[76] Bob Derlet,[77] the Democratic nominee in 2016, also endorsed Morse in January.

    On the Republican side, McClintock had one challenger, Mitchell Kendrick White, who filed with the FEC in January.[78]

    In February, the California Democratic Party (CDP) endorsed[79] Jessica Morse in a contested nomination. Roza Calderon was able to successfully collect 322 CDP-credentialed delegate signatures needed to block the endorsement, in which Morse only received 44 delegate votes. However, CDP staff refused to accept the forms after it was alleged they closed doors early to prevent the submission. A petition was later filed with the Compliance Review Commission (CRC)[80] by Calderon. The CRC voted to accept and count the signatures, ultimately disqualifying enough signatures to proceed with Morse's endorsement.

    California allows candidates to include their professional description under their names on the ballot. Regina Bateson challenged Morse's ballot designation title of "National Security Fellow" at the Sacramento Superior Court after months of controversy that Morse, who had not worked in three years, was "fluffing" her credentials.[81] California's Secretary of State, Alex Padilla, struck down Morse's three ballot designations before Judge Gevercer ruled[82] that she presented "no credible evidence" to use the ballot designation of "National Security Fellow". Instead, he held that this title would mislead the average person about her recent activities. In the official Certified Candidate List for the primary election,[83] Morse's ballot designation was left blank.

    Under the California nonpartisan blanket ("jungle") primary system, only the two candidates with the most votes on June 5, regardless of party, went on to the general election on November 6. Two Republicans and four Democrats appeared on the primary ballot.[79] Morse finished second, qualifying for the general election ballot, along with McClintock.

    For the November ballot, Morse was also denied "National Security" as her designation.[84] In the November general election, McClintock held the district with an advantage of more than eight percentage points.[85]

    2020[edit]

    2020 United States House of Representatives elections in California
    Party Candidate Votes %
    Republican Tom McClintock (incumbent) 247,291 55.9
    Democratic Brynne S. Kennedy 194,731 44.1
    Total votes 442,022 100.0
    Republican hold

    2022[edit]

    2022 United States House of Representatives elections in California
    Party Candidate Votes %
    Democratic Mike Thompson (incumbent) 176,900 67.8
    Republican Matt Brock 84,007 32.2
    Total votes 260,907 100.0
    Democratic hold

    See also[edit]

    References[edit]

    1. ^ a b c "CA 2022 Congressional". Dave's Redistricting. January 4, 2022. Retrieved November 11, 2022.
  • ^ "My Congressional District".
  • ^ "2022 Cook PVI: District Map and List". Cook Political Report. July 12, 2022. Retrieved January 10, 2023.
  • ^ "Maps: Final Congressional Districts". Citizens Redistricting Commission. Archived from the original on March 10, 2013. Retrieved February 24, 2013.
  • ^ "Editorial: 4th Congressional District", The Sacramento Bee, May 10, 2006
  • ^ "2018 California's 4th Congressional District election". Ballotpedia. Retrieved March 3, 2019.
  • ^ California's 4th Congressional District Ballotpedia.
  • ^ "Solano County - NOVEMBER 8, 2022 - Election Results".
  • ^ "Statement of Vote (2000 President)" (PDF). ca.gov. Archived from the original (PDF) on May 20, 2011. Retrieved May 7, 2018.
  • ^ "Statement of Vote (2000 Senator)" (PDF). ca.gov. Archived from the original (PDF) on May 20, 2011. Retrieved May 7, 2018.
  • ^ Statement of Vote (2002 Governor) Archived November 11, 2010, at the Wayback Machine
  • ^ "Statement of Vote (2003 Recall Question)" (PDF). ca.gov. Archived from the original (PDF) on May 20, 2011. Retrieved May 7, 2018.
  • ^ "Statement of Vote (2003 Governor)" (PDF). ca.gov. Archived from the original (PDF) on May 20, 2011. Retrieved May 7, 2018.
  • ^ "Statement of Vote (2004 President)" (PDF). ca.gov. Archived from the original (PDF) on August 1, 2010. Retrieved May 7, 2018.
  • ^ Statement of Vote (2004 Senator) Archived August 10, 2011, at the Wayback Machine
  • ^ Statement of Vote (2006 Governor) Archived August 10, 2011, at the Wayback Machine
  • ^ Statement of Vote (2006 Senator) Archived August 10, 2011, at the Wayback Machine
  • ^ "(2008 President)". 2008racetracker.com. Archived from the original on June 26, 2009. Retrieved May 7, 2018.
  • ^ "Statement of Vote (2010 Governor)" (PDF). ca.gov. Archived from the original (PDF) on May 20, 2011. Retrieved May 7, 2018.
  • ^ "Statement of Vote (2010 Governor" (PDF). ca.gov. Archived from the original (PDF) on May 20, 2011. Retrieved May 7, 2018.
  • ^ "Counties by Congressional District for Recall Question" (PDF). sos.ca.gov. September 14, 2021. Retrieved May 2, 2022.
  • ^ "Counties by Congressional Districts for Governor" (PDF). sos.ca.gov. November 8, 2022. Retrieved May 4, 2023.
  • ^ "JoinCalifornia - James J. Ayers". www.joincalifornia.com. Archived from the original on March 3, 2016. Retrieved May 7, 2018.
  • ^ "1920 election results" (PDF). house.gov. Archived (PDF) from the original on December 29, 2011. Retrieved May 7, 2018.
  • ^ "1922 election results" (PDF). house.gov. Archived (PDF) from the original on July 9, 2014. Retrieved May 7, 2018.
  • ^ "1924 election results" (PDF). house.gov. Archived (PDF) from the original on June 7, 2016. Retrieved May 7, 2018.
  • ^ "1926 election results" (PDF). house.gov. Archived (PDF) from the original on June 8, 2016. Retrieved May 7, 2018.
  • ^ "1928 election results" (PDF). house.gov. Archived (PDF) from the original on May 25, 2017. Retrieved May 7, 2018.
  • ^ "1930 election results" (PDF). house.gov. Archived (PDF) from the original on April 23, 2012. Retrieved May 7, 2018.
  • ^ "1932 election results" (PDF). house.gov. Archived (PDF) from the original on August 17, 2008. Retrieved May 7, 2018.
  • ^ "1934 election results" (PDF). house.gov. Archived (PDF) from the original on August 18, 2008. Retrieved May 7, 2018.
  • ^ "1936 election results" (PDF). house.gov. Archived (PDF) from the original on August 20, 2008. Retrieved May 7, 2018.
  • ^ "1938 election results" (PDF). house.gov. Archived (PDF) from the original on August 19, 2008. Retrieved May 7, 2018.
  • ^ "1940 election results" (PDF). house.gov. Archived (PDF) from the original on January 5, 2007. Retrieved May 7, 2018.
  • ^ "1942 election results" (PDF). house.gov. Archived (PDF) from the original on August 22, 2008. Retrieved May 7, 2018.
  • ^ "1944 election results" (PDF). house.gov. Archived (PDF) from the original on July 9, 2014. Retrieved May 7, 2018.
  • ^ "1946 election results" (PDF). house.gov. Archived (PDF) from the original on May 10, 2013. Retrieved May 7, 2018.
  • ^ "1948 election results" (PDF). house.gov. Archived (PDF) from the original on June 28, 2011. Retrieved May 7, 2018.
  • ^ "1950 election results" (PDF). house.gov. Archived (PDF) from the original on October 29, 2013. Retrieved May 7, 2018.
  • ^ "1952 election results" (PDF). house.gov. Archived (PDF) from the original on December 29, 2011. Retrieved May 7, 2018.
  • ^ "1954 election results" (PDF). house.gov. Archived (PDF) from the original on December 29, 2011. Retrieved May 7, 2018.
  • ^ "1956 election results" (PDF). house.gov. Archived (PDF) from the original on November 6, 2011. Retrieved May 7, 2018.
  • ^ "1958 election results" (PDF). house.gov. Archived (PDF) from the original on January 5, 2007. Retrieved May 7, 2018.
  • ^ "1960 election results" (PDF). house.gov. Archived (PDF) from the original on November 6, 2011. Retrieved May 7, 2018.
  • ^ "1962 election results" (PDF). house.gov. Archived (PDF) from the original on August 3, 2010. Retrieved May 7, 2018.
  • ^ "1964 election results" (PDF). house.gov. Archived (PDF) from the original on July 26, 2011. Retrieved May 7, 2018.
  • ^ "1966 election results" (PDF). house.gov. Archived (PDF) from the original on November 6, 2011. Retrieved May 7, 2018.
  • ^ "1968 election results" (PDF). house.gov. Archived (PDF) from the original on September 20, 2011. Retrieved May 7, 2018.
  • ^ "1970 election results" (PDF). house.gov. Archived (PDF) from the original on December 7, 2014. Retrieved May 7, 2018.
  • ^ "1972 election results" (PDF). house.gov. Archived (PDF) from the original on August 14, 2011. Retrieved May 7, 2018.
  • ^ "1974 election results" (PDF). house.gov. Archived (PDF) from the original on October 27, 2011. Retrieved May 7, 2018.
  • ^ "1976 election results" (PDF). house.gov. Archived (PDF) from the original on August 14, 2011. Retrieved May 7, 2018.
  • ^ "1978 election results" (PDF). house.gov. Archived (PDF) from the original on September 28, 2011. Retrieved May 7, 2018.
  • ^ "1980 election results" (PDF). house.gov. Archived (PDF) from the original on January 23, 2017. Retrieved May 7, 2018.
  • ^ "1982 election results" (PDF). house.gov. Archived (PDF) from the original on August 14, 2011. Retrieved May 7, 2018.
  • ^ "1984 election results" (PDF). house.gov. Archived (PDF) from the original on October 27, 2011. Retrieved May 7, 2018.
  • ^ "1986 election results" (PDF). house.gov. Archived (PDF) from the original on January 23, 2017. Retrieved May 7, 2018.
  • ^ "1988 election results" (PDF). house.gov. Archived (PDF) from the original on July 1, 2011. Retrieved May 7, 2018.
  • ^ "1990 election results" (PDF). house.gov. Archived (PDF) from the original on July 16, 2011. Retrieved May 7, 2018.
  • ^ "1992 election results" (PDF). house.gov. Archived (PDF) from the original on January 23, 2017. Retrieved May 7, 2018.
  • ^ "1994 election results" (PDF). house.gov. Archived (PDF) from the original on May 25, 2017. Retrieved May 7, 2018.
  • ^ "1996 election results" (PDF). house.gov. Archived (PDF) from the original on May 25, 2017. Retrieved May 7, 2018.
  • ^ "1998 election results" (PDF). house.gov. Archived (PDF) from the original on January 23, 2017. Retrieved May 7, 2018.
  • ^ "2000 election results" (PDF). house.gov. Archived (PDF) from the original on May 25, 2017. Retrieved May 7, 2018.
  • ^ 2002 general election results Archived February 3, 2009, at the Wayback Machine
  • ^ 2004 general election results Archived August 21, 2008, at the Wayback Machine
  • ^ 2006 general election results Archived November 27, 2008, at the Wayback Machine
  • ^ a b "Election Results - November 4, 2008 - California Secretary of State". Archived from the original on November 26, 2008. Retrieved November 30, 2008.
  • ^ https://elections.cdn.sos.ca.gov/sov/2012-general/06-sov-summary.xls
  • ^ https://elections.cdn.sos.ca.gov/sov/2014-general/xls/06-summary.xls
  • ^ https://elections.cdn.sos.ca.gov/sov/2016-general/sov/csv-candidates.xls
  • ^ "Federal Election Commission, Registered Candidates in California's Fourth Congressional District". Federal Election Commission. Retrieved July 27, 2017.
  • ^ "Rochelle Wilcox". Rochelle Wilcox. Archived from the original on January 19, 2018. Retrieved January 25, 2018.
  • ^ @Morse4America https://twitter.com/Morse4America/status/969295288740470785. Archived from the original on May 7, 2018. Retrieved January 12, 2018. {{cite web}}: Missing or empty |title= (help)
  • ^ Johnson, Doug (April 8, 2017). "Although Tough on Trump, McClintock Faces Backlash at Another Town Hall". KTXL. Archived from the original on April 11, 2017. Retrieved April 10, 2017.
  • ^ "I am thrilled & grateful to be endorsed by Charlie Brown, 2006 & 2008 Congressional Candidate for #CA04. From Charlie: "Jessica has the knowledge & experience to best represent the people in the 4th Congressional District." To read his full statement". Archived from the original on May 7, 2018.
  • ^ Morse, Jessica (January 11, 2018). "We are so grateful to have the support of community leaders, such as Dr. Bob Derlet - the 2016 Democratic candidate for #CA04! "I am behind Jessica because she is a fighter. She will stand up for the people of this district & not back down." Thank you, Dr. Derlet! #JessWeCanpic.twitter.com/e5tv0OC6bk". @Morse4America. Archived from the original on May 7, 2018. Retrieved January 12, 2018.
  • ^ "PAGE BY PAGE REPORT DISPLAY FOR 201801199090468752 (Page 1 of 1)". docquery.fec.gov. Retrieved January 25, 2018.
  • ^ a b "Gold Country News | Gold Country Media". Archived from the original on February 28, 2018. Retrieved February 27, 2018.
  • ^ "California Democratic Party Rules Committee Agenda and Packet" (PDF). California Democratic Party.[permanent dead link]
  • ^ Cadei, Emily (February 20, 2018). "Tom McClintock rival Morse is stretches résumé". Sacramento Bee.
  • ^ "Secretary of State Padilla Responds" (PDF). Regina Bateson. March 24, 2018.
  • ^ Padilla, Alex (March 29, 2018). "California Certified List of Candidates" (PDF). California Secretary of State.
  • ^ Anderson, Bryan (September 5, 2018). "ONCE AGAIN, MORSE DENIED 'NATIONAL SECURITY' BALLOT DESIGNATION". Sacramento Bee.
  • ^ "2018 California's 4th Congressional District election". Ballotpedia. Retrieved March 3, 2019.
  • External links[edit]

    38°18′N 119°42′W / 38.3°N 119.7°W / 38.3; -119.7


    Retrieved from "https://en.wikipedia.org/w/index.php?title=California%27s_4th_congressional_district&oldid=1234499669"

    Categories: 
    Congressional districts of California
    Government of Lake County, California
    Government of Napa County, California
    Government of Solano County, California
    Government of Sonoma County, California
    Government of Yolo County, California
    Constituencies established in 1873
    1873 establishments in California
    Hidden categories: 
    Webarchive template wayback links
    CS1 errors: missing title
    CS1 errors: bare URL
    All articles with dead external links
    Articles with dead external links from November 2023
    Articles with permanently dead external links
    Pages using gadget WikiMiniAtlas
    Articles with short description
    Short description is different from Wikidata
    Use mdy dates from November 2019
    Coordinates on Wikidata
    Pages using the Kartographer extension


    This page was last edited on 14 July 2024, at 17:39 (UTC).

    Text is available under the Creative Commons Attribution-ShareAlike License 4.0; additional terms may apply. By using this site, you agree to the Terms of Use and Privacy Policy. Wikipedia® is a registered trademark of the Wikimedia Foundation, Inc., a non-profit organization.


    Privacy policy

    About Wikipedia

    Disclaimers

    Contact Wikipedia

    Code of Conduct

    Developers

    Statistics

    Cookie statement

    Mobile view


    Wikimedia Foundation
    Powered by MediaWiki