中華人民共和国の経済
| 通貨 | 人民元(RMB) | |
|---|---|---|
| 会計年度 | 1月1日 - 12月31日 | |
| 貿易機関など | WTO, APEC,RCEP,G20 | |
| 経済統計 | ||
| 名目GDP | 14兆8630億ドル(2位、2020年)[1] | |
| GDP(PPP)[2] | 23兆97億ドル(第1位、2020年) | |
| 一人当たり名目GDP | 14,863ドル(2020年)[1] | |
| 一人当たりGDP(PPP) | 21,391ドル(2022年)[3] | |
| GDP成長率 | 6.14%(2019年) | |
| 部門別GDP | 農業(7.9%)、工業(40.5%)、サービス業(51.6%)(2017年)[4] | |
| インフレ率 | 2.8%(2019年) | |
| 家計収入あるいは消費における最上位/最下位パーセンタイルの割合 | 最下位10%パーセンタイル: 2.1% 最上位10%パーセンタイル: 31.4% (2012年)[5] | |
| 貧困線未満の人口 | 0.6%(2019年推計)[4] | |
| 労働人口 | 7億7471万人(2019年)[4] | |
| 部門別労働人口 | 第1次産業27.7%、第2次産業28.8%、第3次産業43.5%(2016年)[4] | |
| 失業率 | 3.64%(2019年推計)[4] | |
| 貿易相手国[4] | ||
| 輸出 | 2兆7323億ドル(2020年推計) | |
| 輸出品 | 電子機器、機械類、衣類、繊維、鉄鋼、光学部品、化学部品 | |
| 主要相手国 | ||
| 輸入 | 2兆3626億ドル(2020年推計) | |
| 輸入品 | 電子機器、機械類、化石燃料、光学部品、化学部品、鉱物、プラスチック、有機化学製品 | |
| 主要相手国 | (2019年)[4] | |
| 財政状況[4] | ||
| 国庫借入金 | GDPの22.15%(2012年推計) | |
| 対外債務 | 2.0279兆ドル(2019年推計) | |
| 外貨準備 | 3.236兆ドル(2017年12月31日推計) | |
| 歳入 | 1.838兆ドル(2012年推計) | |
| 歳出 | 2.031兆ドル(2012年推計) | |
中華人民共和国の経済(ちゅうかじんみんきょうわこくのけいざい)では、東アジアに位置する中国(中華人民共和国)の経済について解説する。
概要
編集
中国︵中華人民共和国︶は1970年代後半から2008年まで改革開放政策[6]、WTOへの加盟、外国資本の導入などの手段を通し、農村部からの出稼ぎ労働者という安価かつ豊富な労働力を生かして、製造業を中心とした労働集約型産業において比較優位を獲得し、﹁世界の工場﹂として大きな成長を遂げてきた。
現在中国の経済総量は国内総生産︵GDP︶で換算すると、アメリカに次ぐ世界2番目に大きく、2020年のGDPは14.86兆USドル[n 1]、2020年の購買力平価︵PPP︶は23兆97億800万ドルとなり、世界最大級の経済体に分類できる[7]。1人あたり国民総所得︵GNI︶に基づき2019年までに、中国既に1万ドルを突破し、世界銀行︵世銀︶の定義にしたがうと﹁高所得国﹂入り目前である。
2017年以降、中国共産党習近平政権[8][9]積極的な戦狼外交と米中貿易戦争、新疆ウイグル再教育キャンプなどの事件によって、中国と西側諸国との関係は急速に悪化していく。さらに、ゼロコロナ政策などの影響を受け、外国資本の脱中国が加速し、2023年に中国経済がデフレに入り、若者の失業率過去最高の20.8%に達し、同4月に続き2カ月連続で20%を上回った。
中国経済における全体的な解説
編集
結論から言うと、中国経済は非常に複雑的で不透明な仕組みになっており、良いか悪いかを一言で言い切ることが出来ない。
歴史から見れば、中国は1世紀から19世紀までの2000年間のほとんどの時間帯において、世界最大の経済国の一つになりつつ、産業革命以降には急速に衰退する傾向がある[10][11] 。また、台湾・香港・マカオの経済は中国の中に組み込まれておらず、それぞれ中国と異なって独立な経済システムを採用している。詳しくは台湾の経済・香港の経済・マカオの経済などの項目を参照。
まず、中国の経済政策はソ連のように﹁国営化﹂と﹁五年計画﹂の両方を組み込み、そして独自の﹁中国特色社会主義﹂のやり方を加えて経済発展を遂げた[12]。中国の名目GDPは世界第2位と巨大なものであり、コロナ禍以前(2019年︶の購買力平価︵PPP︶から推算してみると、2030年の時点でアメリカを超えるだろうとの見方がある[13][n 1][14]。現実での実態は一旦置いておき、中国の建前の成長数字だけをみれば綺麗に見える。
次に、中国の為替レートは非常に不安定な構造にしているため、アメリカはそれに応じて毎年自分のドルを基準として先に中国のGDPを予測し、中国の公式データが出たあとに再度GDPを調整する。2022年、中国のPPPは世界経済の約18.6%を占め[15][16]、GDPは18.0%を占めた[17]、2020年代以降、中国は世界の大多数の国々と自由貿易協定を結んでいるにもかかわらず、その不均衡な政治体制や予測不可能の習近平政権の影響で、いくつかの協定は既に失敗しており︵史上最大の貿易圏であるRCEPも含む︶、そもそも交渉の段階で止まってる協定も非常に多い[18]。
成長のスピードを見ると、2019年以前の中国は世界最速の消費市場となり、第2位の商品輸入国にもなった[19]。消費国としても世界最大級であるが、世界金属の消費量の約半分を占めていて、高度な質を有するサービス系の商品に関しては純輸入国である[20]。中国製商品の質が他の商品と比較して低いとはいえ、消費者の総数の多さだけあって、世界で最も競争力の高い金融センタートップ10のうちの4つを擁し[21]、世界最大の証券取引所︵時価総額と取引量の両方で︶10社のうちの3社を占める[22]。
一方、現代中国経済の特徴については、公的部門の企業の利益を最優先し、国有企業(SOE)の利益を奪い、混合所有制企業・民間部門・外国企業の利益をある程度の搾取をしながらも、ほかの共産国家と比べるとより自由、より開放的な態度で経済にとっている。外国企業による民間投資や外国への輸出品はもともと中国経済が成長における最大の動力であるが、2020年代に勃発した米中貿易戦争以来、中国政府は外国からの投資を何度も拒絶し、国内での消費だけを重視している[23]。国内向けの生産を専念した結果、中国は世界最大級の製造業を造り、最大の商品輸出国になった[24]。
外国との経済関係について、コロナ禍以前の中国は外国からの直接投資を多数受け入れ、合計1630億ドルを吸収していた[25]。同国の対外直接投資は2019年の一年だけで1369億1000万米ドルに達し、世界最大の投資国である日本の2266億5000万米ドルに次いで世界で2番目に大きい[26]。3年後の2022年には、中国国内の億万長者の総数は世界で2番目の多さとなっている[27][28]。中国が2007年から2008年までの金融危機に直面できた理由は、この外貨準備の多さにあり、対外貿易が活発か停滞かは関係なく、世界最大の貿易国の立場を利用して国際貿易の中で存在感を出した[29][30]。
しかし、中国経済の実態を精査すると、どの産業においても一定の貧富の差を生み出し、特に低所得者層は中国の中で最も深刻な問題となっている。中国は約3兆1000億ドル︵日本円にして約458兆8000億円ほど。1ドル=148円で換算︶に相当する世界最多の外貨準備金を保有しているものの、そのほとんどは中国共産党の官僚を通じて、アメリカ国内で消費されているものであり、中国の一般市民は外貨の利益から得られるものはほぼゼロに等しい。2018年にはミリオネア数は350万人で世界第2位となり、アメリカと比較すると、クレディ・スイス・グループの﹃2019年世界財富報告書﹄の資料によれば、世界人口の富の内訳は上位10%が中国人が占めており、アメリカを上回った[31][注1]。
アメリカ以外、例えば欧州と比べると、2021年の﹃ピュー・リサーチ・センター﹄の調査では約4200万の中国人が中産階級に分類されている。中国の約14億の総人口と比べるとやや低いが、その多さは中流階級だけで1つの欧州国家の総人口にも相当する。中国経済の総量は欧州連合の5分の4の経済量を追い抜き[32]、2022年の時点で、中国本土のトップ10の輸入相手国は欧州連合が第1位で、次いでアメリカ、韓国、日本、台湾、香港、ベトナム、オーストラリア、マレーシア、ロシアの順となる[33]。製造業の強国、または世界の工場として広く看做されているが[34] 、前述の通り、現在は中国の輸出の割合が小さくなり、2020年に欧米や日韓への輸出はわずか全体経済の18.5%に過ぎない。
そして、他国の知的財産の模倣については中国従来の問題であり、2022年の﹃グローバル・イノベーション・インデックス﹄のランクによると、中国が世界第11位、アジアおよびオセアニア地域で第3位、人口1億人以上の国では第2位に位置付けられている。上位30位に入っている国々の中で、唯一の中所得国であり、また唯一の新興工業国でもある[35][36]。しばしば世界で最も革新的な国の一つにも位置付けられ、模倣であっても世界の特許出願のいくつかの指標は世界でもトップクラスになっている[37][38]。そんな中でも世界トップ5の科学技術集団のうち、4つ(﹁深圳・香港・広州の都市群﹂と﹁北京﹂︶を創り、それぞれ2位と3位に占めている。中国人がほぼ4Gや3Gしか使えない事実を無視して、中国政府は2022年3月の時点で、すでに5億台の最新型5G発信機、145万個の大型5G電波基地を設置していた[39][40]。
2023年の時点で、金融資産から吸収した資金は国民のために一度も使ったことがなく、すべて不動産や建築業など中国政府の関係機構に譲った。中国は世界で2番目に大きな金融資産を保有しており、価値に関しては17.9兆ドルに達しているものの、中国にとって最も重要なハイテクや軍事に関しては恩恵がない。中国の市民については、7億7800万人が可用の労働者となり、2020年時点では世界最大の労働力市場の中で競争をし続け、﹃世界競争力レポート﹄の中で第28位を獲得した[41]。市民を除いて、富裕層・商業銀行・海外企業が中国人労働者から得た収益を見ると、1980年代から2020年代までで4兆ドル近く増加した[42]。
最後に、気候変動を引き起こす温室効果ガス︵GHG︶の分野において、中国の環境汚染排出物質量は世界一であることと同時に、中国人自身も汚染の悪影響を受けている。中国の一人当たりのグリーンエネルギーや環境保育への貢献も、アメリカや欧州などの先進国より遥かに低い[43]。また、利益を図る世界の大手企業500社のうちに145社が中国に進出した経験があるが、人間にとっての労働環境が劣悪であり、本社を中国に置く外資会社は極端に少ない。
歴史
編集中国経済史全般については「中国の経済史」を、1978年以前の中華人民共和国経済の詳細については「en:Economic history of the People's Republic of China」を参照
改革開放以前
編集
1949年、国共内戦に敗れた国民政府が台湾に逃れて、中国大陸を支配した中国共産党は中華人民共和国の建国を宣言した︵10月1日︶。中国政府は工業発展戦略を採用し、急速な産業化を最優先としている間、消費は減らされた。中国政府は経済の多くの部分を統制し、資源を建物や新しい工場の建設に振り分け、新しい産業が生み出された。より重要なことは経済成長を後押ししたことであった。予算とマネーサプライの厳しい制限により1950年末にはインフレが抑制された。また、建国から間もない1950年6月30日、中華人民共和国土地改革法が公布された。政府からの指導と農民たちの地主に対する自主的な闘争も相俟って、﹁1952年春には土地改革は既に全国的に範囲にわたって基本的に完成した﹂と宣言された。自分で耕す田畑を持つことにより、農民の生産意欲は向上し、1952年の農産品の約半数の項目で1949年以前の最高を突破した[注釈1]。
こうして、日中戦争、国共内戦による経済のダメージから中国の経済は回復していった。ちなみに第二次世界大戦直前の1937年のGDPランキング︵植民地含む︶では1位アメリカ合衆国、2位大英帝国︵イギリス︶、3位ソビエト連邦、4位ナチスドイツ、5位中華民国、6位大日本帝国、7位フランスという順であった。
1952年の中国の工業生産高は当時の価格換算で349億元と推定されている[45]。それは当時の世界のGDPの約3%を占め、日本やインドのGDPの1.5倍であった︵しかし、一人当たりGDPではない︶。1950年代の日本の人口が8360万人で中国は5億4480万人であったため、中国の社会・経済に混乱を引き起こした文化大革命︵文革︶前の中国の経済は、文革後ほどの貧困ではなかった。一人当たりGDPも1960年代はわずか17%しか成長しなかった[46]。1960年の時点で、日本のGDPは中国と同レベルだった。
その後、第1次五カ年計画︵1953 - 1957年︶でソビエト連邦型の計画経済を模倣し、重化学工業への投資を行い、経済成長を達成した[注釈2]。
毛沢東は1958年に当時世界2位の経済大国であったイギリスを追い抜くために野心的な計画の遂行を指示した。農業の集団化︵人民公社︶を行い、農民を大量に動員しての鉄鋼増産が行われたが、鉄鋼生産に伴う環境破壊は農業生産量の減少を引き起こし、最終的には数千万人の餓死者を生み出し失敗に終わった︵大躍進政策︶。
大躍進政策の失敗により、毛沢東は最高権力者の地位をいったん降り、劉少奇、鄧小平らが、経済調整を行った。農村の集団化の見直しを図り、農家にわずかではあるが自由に耕作できる農地を与え、農業生産のインセンティブを付与した。
しかし、毛沢東が文化大革命を発動して復権すると、劉少奇や鄧小平らは失脚した。この間、知識青年が都市から農村に学習の為に上山下郷運動されたり、毛沢東謁見の為に紅衛兵を輸送したりしたことにより経済活動は停滞した。
改革開放以降
編集第11期三中全会
編集
1976年に毛沢東が病没し、四人組が逮捕されると鄧小平は権力を奪取した。そして、1978年の第11期三中全会で改革開放路線が採用され、従来のソ連型の計画経済は否定され、市場指向型の経済に大きく舵を切った。
1978年12月の中国共産党第十一期中央委員会第三回全体会議で鄧小平が主導する改革開放路線を採用して以降、中国政府は計画経済から市場経済への改革を続けてきている。この経済体制は﹁中国の特色を持った社会主義市場経済︵en/zh︶﹂と呼ばれており、中華人民共和国の経済体制は市場経済と計画経済の混合経済である。
1978年来の経済改革の結果、数億の中国人民が貧困線から脱出することに成功した。1981年には人口の53%が貧困線以下だったが、2019年には0.6%にまでに減少した[4]。依然全体の生活水準は低いものの、中産階級の数は世界最大となっている[48]。
中国政府は農業をかつての人民公社から生産責任制に変更し、産業における地方政府の権限を増やし、サービス業や軽工業における様々な小規模企業︵郷鎮︶を許可し、外国との貿易や投資を増やす為に経済を開放した。政府は個人の収入及び消費の増加や、生産性向上を助ける為の新しい管理制度の導入を強調した。中国政府の統計の正確さに対して議論する点は残っているが、中華人民共和国の経済は1978年の10倍にまで成長した。
1980年代
編集
1980年代になると、中国政府は中央集権の計画経済とインフレや失業、財政赤字無しに生産性と生活水準、技術水準を増大させる為の市場指向型の経済を組み合わせようとした。中国政府は人民公社を解体し、農民に、農作の決定権を与えるという生産責任制を採用する農業改革を実行した。また、農村部で郷鎮といった非農業活動を勧め、より自発的な国有企業の経営を推奨し︵従来は中央の管理下にあった︶、市場競争を強め、中国大陸と外国企業との直接の接触を促進した。その上、中国政府は改革開放以前の時よりも、外資や輸入に依存した。
中国の最高指導者である鄧小平は1984年6月30日、次のように発言した。
社会主義とは何か?そしてマルクス主義とは何か?我々は過去、このことについてあまりはっきりとさせてこなかった。マルクス主義は生産力を増加させることをことさら強調した。我々が言ってきたことは社会主義は共産主義の第一段階であること、そして、発展段階では能力によることから必要性によることにいたるまでの原則があてはまるということである。その原則は高度に発達した生産力と物質的豊かさを要求している。それゆえ社会主義の段階への基本的な課題は生産力を増加させることである。資本主義体制下での生産力よりも早く、大きく社会主義体制下での生産力が増加することによって、社会主義体制における優越性が示される。生産力が増加するにつれ、人民の物質的・文化的生活は絶えず発展する。中華人民共和国建国後の我々の欠点は生産力を増加させることに気づかなかったのである。社会主義は貧困を根絶することを意味する。平等主義は社会主義でなく、いわんや共産主義でもない — 英訳より引用者により重訳[49]。

中華人民共和国の経済特区
そして、1984年、4つの経済特区︵北から廈門、汕頭、深圳、珠海︶と14の対外開放都市︵大連、秦皇島、天津、煙台、青島、連雲港、南通、上海、寧波、温州、福州、広州、湛江、北海︶を設置し、外資を呼び込んだ︵その後、海南省が経済特区に指定された︶。
1980年代の間、経済改革により農業及び工業生産高が毎年約10%で成長した。農村の実質所得は2倍になった。中国は穀物を自給できるようになった。農村工業は農村における過剰労働力の吸収に役立った。様々な軽工業の品々や消費財が増加した。経済改革は、財政面、金融面、物価の安定、労働市場の面で始まった。
経済成長の暗黒面として、中国は社会主義の最悪の結果︵官僚主義、汚職、財産権の侵害︶と資本主義の最悪の結果︵貧富の格差、急激なインフレ︶に直面することになった。中国政府は定期的に中央集権による引き締めと緩和の政策を行った。1988年の終わりには、価格改革の急速な進展によってもたらされたインフレ[注釈3]への対応として、緊縮財政を実行した。

1990年代から2010年代まで
編集
1989年、六四天安門事件による民主化運動の弾圧によって一旦経済の停滞を示したが[注釈4]、1990年代初期に、中国経済は回復した。1992年春節の時期に鄧小平は、中国の南方を訪問した︵南巡講話︶。1992年末の第14回中国共産党全国代表大会で鄧小平は中国政府の責務は1990年代に﹁社会主義市場経済﹂を構築することだと述べ、市場改革を改めて推進した。南巡講話は1990年代の10年間の経済発展計画のお墨付きとして、政治体制は中国共産党の支配の継続及び経済体制の大幅な変革が推進された。
1993年、経済成長とインフレが加速した。中国国外からの投資が浸透し、外資の進出が容易になったことにより経済は拡大した。中国政府は市場指向型の経済制度を構築するのに一層役立てること、また、金融システムを中央でコントロールすることを強化することを狙い、長期間の改革を承認した。社会主義市場経済の名の下に国有企業が主要産業を支配することを継続した。中国政府は投機的な融資に対し回収に動き、利子を上げ投資計画の見直しを行った。結果、インフレ率は1995年の17%から、1996年初めには8%にまで落ち着いた[50]。1990年代後半にはアジア通貨危機の影響により経済成長は鈍化したが、21世紀には経済成長が加速した[注釈5]。

2005年におけるGDP比較。緑は日本、赤はインド、紫はドイツ、 水色はフランス、青は中国。単位は億ドル。
2005年12月、中華人民共和国国家統計局は、2004年の中国の名目GDPを16.8%上方修正した2兆3363億元︵2819億ドル︶[52] であり、イタリアを追い抜き世界第6位の経済規模であると発表した。2005年、中国のGDPの70%は民間部門が占めており、公有部門は公益事業、重化学工業、資源・エネルギーといった約200の大規模な国有企業によって支配されている[53]。
2006年初め、中国政府はUSドル為替換算レートで計算しなおした場合、第4位であり、イギリス、フランスを追い抜いたと発表した。2007年初め、購買力平価ベースでは中国の経済規模は世界2位の約10兆ドルに達した。但し、購買力平価による計算はかなりラフなものであり、中国のような巨大な国家では上海や四川省の間では購買力平価にかなりの開きがある点は留意する必要がある。
中国は為替換算レートベースではドイツを追い抜き、第3位になり、2010年には日本を追い抜き、第2位となった[54]。また、John Bryan Starrによると2040年までにはアメリカ合衆国を追い抜くと予測されている[55]。2015年には購買力平価で欧州連合を超えて世界初の20兆ドル以上のGDPに達した国となった。

2020年代と一人当たりGDP
編集中国経済の課題
編集広がる経済格差
編集「zh:中华人民共和国国内生产总值」も参照
| 2021年の1人あたり地区別省内総生産(単位、元)[60] | |||||||||||||||
|---|---|---|---|---|---|---|---|---|---|---|---|---|---|---|---|
| 西部 | 中部 | 東部 | 東北 | ||||||||||||
| 内蒙古 | 8.53万 | 山西 | 6.47万 | 北京 | 18.39万 | 遼寧 | 6.48万 | ||||||||
| 広西 | 4.94万 | 河南 | 5.93万 | 天津 | 11.32万 | 吉林 | 5.5万 | ||||||||
| 重慶 | 8.7万 | 江西 | 6.55万 | 河北 | 5.41万 | 黒竜江 | 4.67万 | ||||||||
| 四川 | 6.44万 | 安徽 | 7.04万 | 山東 | 8.18万 | ||||||||||
| 貴州 | 5.08万 | 湖北 | 8.66万 | 上海 | 17.38万 | ||||||||||
| 雲南 | 5.57万 | 湖南 | 6.93万 | 江蘇 | 13.73万 | ||||||||||
| 西蔵 | 5.5万 | 浙江 | 11.39万 | ||||||||||||
| 陝西 | 7.54万 | 福建 | 11.75万 | ||||||||||||
| 甘粛 | 4.09万 | 広東 | 9.87万 | ||||||||||||
| 青海 | 5.65万 | 海南 | 6.42万 | ||||||||||||
| 寧夏 | 5.28万 | ||||||||||||||
| 新疆 | 6.19万 | ||||||||||||||
| 2016年の地区別省内総生産合計(上段、単位:億元、%)[60]、人口(下段、単位:万人、%)[注釈 6]及び構成比。 | |||||||||||||||
| 西部 | 中部 | 東部 | 東北 | ||||||||||||
| GDP合計 及び構成比 |
156,828.17 (20.1%) |
GDP合計 及び構成比 |
160,645.57 (20.6%) |
GDP合計 及び構成比 |
410,186.44 (52.6%) |
GDP合計 及び構成比 |
52,409.79 (6.7%) | ||||||||
| 人口合計 及び構成比 |
37,414 (27.1%) |
人口合計 及び構成比 |
36,709 (26.6%) |
人口合計 及び構成比 |
52,951 (38.4%) |
人口合計 及び構成比 |
10,910 (7.9%) | ||||||||
-
-
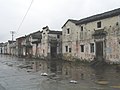 農村の労働者が大挙して都市に向かい、農村の人口が減少した江南の某農村。
 -
-


1995年から1999年の間、中央銀行による金融引き締めならびに食糧価格の上昇を防いだことを反映し、インフレは収束した。同時に中国政府は(a)省、企業、個人から歳入を増やすこと、(b)腐敗及び経済犯罪の減少を減らすこと、(c)経済成長しているにもかかわらず、経営改革が進まないことにより労働者に十分に賃金や年金が払えず倒産しかねない多くの大規模の国有企業を破綻させないことに努めてきた。
改革開放以降、農業生産額が増加し、農家所得も徐々に向上してはいるが、沿海都市での急速な工業発展や住民の所得増加には追いつけず、都市と農村の格差は拡大している。沿岸部︵東︶と内陸部︵西︶間の経済格差—例えば2005年において上海と貴州省の1人あたり収入は表を見ても分かるように約10倍と拡大している--、農村‐都市間の経済格差—2005年には都市住民の一人当たり賃金は10,493元なのに対し、農村の一人当たり純収入は3,255元に過ぎず、その格差は都市‥農村=3.22‥1となっている[62]。経済格差のため、農村から都市部へ多くの労働者が豊かさを求め出稼ぎし、低賃金の日雇いの仕事に従事している。農村から都市への人口移動は合法的に、あるいは水面下で続き、農村は労働力の確保に苦慮している。
地域間経済格差を是正する為、西部大開発が実施されている。また、中国政府は農業保護に重点を置き始め、2006年からは農業税の全廃を実施した。これは春秋時代の魯以来、中国の農民に課されてきた地税が約2600年ぶりに撤廃された歴史的決定で、中国は封建体制から毛沢東主義まで前提となっていた農業中心社会から改革開放政策による商工業中心の社会へと移行した事を象徴する出来事になった。
過熱する中国経済
編集
中国経済の他の重要な課題は、過去10年の急速な経済成長による経済の過熱とインフレが世界経済に影響を与える恐れがあるということである。中国政府は、インフラが整備されておらず、経済の舵取りがあまり上手くいっていない為、ある特定の地域が経済が過熱気味であることを認めているが、全体的には経済は過熱しているということは否定している。
課税もまた、ある特定部門や特定産業に対し減税をしている中国経済を安定させるための課題である。特定部門や特定産業への減税政策の主な狙いは、都市-農村間の投資の格差を減らし、国有企業が外資との競争に勝つように促す為のものである。
一方、急速な経済成長は環境問題を引き起こしている︵中華人民共和国の経済#環境︶。
労働
編集失業
編集
中国の社会主義経済の顕著な特徴の一つに、労働者全員の雇用及び年金を保証するというのものがあった。しかし改革派は、労働市場を非生産的であると標的にした。というのも、企業は頻繁に社会主義者の目標及び雇用の保証を満たす為に過剰に労働者を雇い入れ、労働者が働く意欲を失わせたからである。この社会主義政策は軽蔑的に鉄飯碗︵zh︶と呼ばれた。
1979年から1980年にかけて、中国政府は労働者に賃金を増やすことにより工場の改革を進めたがこれはインフレ率が6~7%と急激に上がってきた為相殺された。換言すれば、労働者に賃金を払えば払うほど、物価が上昇し、貨幣価値が下落し、労働者は物を買う量が少なくなり、より貧しくなったということである。国家は部分的に賃金への補助を分配することによりこの問題を部分的に改善した。
1979年に鉄飯碗を解体した後、2000万人の失業者が発生した[63]。
2019年推定での失業率は3.64%[4] になっている。しかし2023年には若者の失業率が上昇し6月には16~24歳における値が過去最高を更新する21.3%となったうえ、同年8月15日には﹁卒業前に就職活動を行う学生を調査対象に含めるべきかについて検討する必要がある﹂ため当面統計の公表を停止すると明らかにしている[64]。
労働力不足
編集
2005年、より高い賃金、よい職場環境を選ぶことができ、制限のある寮生活から離れることが出来たり、広東省や福建省の、輸出産業が主体の退屈な工場勤務から離れたりすることが出来る労働に対する強い需要があった。
企業が人材を確保する為に先を争って従業員に毎月平均150ドル程度を払った為、最低賃金が1月に100ドルも上がり始めている。厳格な家族計画︵一人っ子政策︶の結果として、労働力不足は部分的には中国の人口動態︵en︶に起因している[65]。
米紙﹃ニューヨーク・タイムズ﹄は、人件費は上昇し続け、非熟練労働者の不足により百万人以上の従業員の求人があったと報告した。低賃金の労働に依存した企業経営は、中国内陸部か或いはベトナムやバングラデシュといった国々へ拠点を移し続けることになる。多くの若者が最低賃金の工場で働くよりも大学進学を希望しており、一人っ子政策に起因する人口変動により、若年の内に働き始める人数が減り続けている。また、最近は、政府主導の内陸部の経済発展を進める努力により新たな雇用が創出されている[66]。
労働法
編集
中国は、労働者への不払いといったありふれた労働問題を解決するための労働法を施行しており、2006年に改正された新しい労働法では、パブリックコメントを求めていた。合法的な労働組合は中華全国総工会︵zh、中国共産党が公式に認めている労働組合の全国組織である︶と提携関係を続けている。労働法の草稿段階では欧米諸国に似た団体交渉権が許可されている。労働運動家は新しい労働法を支援しているが、一方で外資企業︵欧米企業の支店を含む︶は反対している。とはいっても法律が制定されれば、労働問題の改善があるという予想されており[67]、2006年ウォルマートで労働組合が結成され、その後、イーストマン・コダック、Dell等の外資企業でも労働組合が結成された[68]。﹃日本経済新聞﹄によると、孫春蘭・中華全国総工会副主席は記者会見で2008年には外資系企業の労働組合の総組合員数が2億人に達するとのことである[69]。また、この記事では、孫副主席は﹁いまだに三割の外資が立ち上がっていない。今後一層の普及を図りたい﹂[69] とコメントしている。
人口問題
編集
共産党政府の成立後、中華人民共和国では急激な人口増加が進んだことにより、食糧問題、エネルギー問題などが発生した。人口増加に危機感を抱いた政府は、対策として1979年から一人っ子政策を実施し、出生率の統制による人口抑制を展開した結果、人口増加率は低下した。
しかし一方で、戸籍上は子供を一人しか持たないようにするため、出産しても届出を行わないことによって黒孩子︵ヘイハイズ︶と呼ばれる戸籍を持たない子供が激増したり、貧乏な農家の子供たちが人身売買のバイヤー経由で裕福な家庭に売られるなど、新たな問題が発生した。また、統計上では人口は13億人であるが、黒孩子や盲民と言われる浮浪民の存在のため、潜在的な人口は15億人を超えているともいわれる[70]。清水美和は、10年ごとに行われている中華人民共和国国勢調査は、2000年に実施した中華人民共和国第5回国勢調査では13億人と発表したが、実際は15億人だったという[71]。そして、2010年に実施した中華人民共和国第6回国勢調査では、実際は17億人だったが、15億人として発表するのではないか、と述べている[71]。2011年2月28日、国家統計局は13億4100万人と発表した[72]。
2020年に中国史学者の朴漢濟︵ソウル大学校︶は、中国の人口は公式統計では13億人であるが、実際は17億人であり、世界人口︵約70億人︶の4人に1人が中国人であると指摘している[73]。
また、急激な出産制限は全人口に占める若年層の割合を低下させた。そのため、少子化、高齢化が問題になると指摘されている。
2016年に人口爆発を止めるための”一人っ子政策”を撤廃し、2人目の出産が認められたが、出生率は減少の一途を辿った。2021年、全国人民代表大会の常務委員会は人口・計画出産法の改正を決定し、”三人っ子政策”を開始した。これは夫婦に三人までの出産を認める上で、国が住宅や教育などで支援措置を講じ、家庭の負担を軽減する。
国内では、沿岸部など経済発展の著しい地域と、内陸部の発展に取り残された地域との経済格差が拡大しているため、沿岸の都市部に出稼ぎするために流入する農民工が増え2021年の数値では2億9,251万人である[74]。
中野剛志はアーネスト・ゲルナーを例に、農民が沿海部に出稼ぎに行って豊かな所得を得るという人口移動が行われた場合、民族意識を刺激すると述べている。日本の場合、同質性が高い民族性を持つ国民であり、国民統合がすでになされておりエスニシティの摩擦が少ないが、中国のように国内に異質な民族性を有していると必ず問題が生じるとしている。そのため、チベット自治区や新疆ウイグル自治区で頻繁に暴動が起きているのは驚くべきことではないとしている[75]。
通商上の問題
編集詳細は「#貿易」を参照
中国経済の拡大に伴い中国の貿易額も増加している。130を超える国が中国を最大の貿易相手としており︵2019年時点︶、中国の要求や圧力に逆らえない国が増える要因になっている[76]。
通商上の問題として、急激な生産能力の拡大を背景とした輸出増加、安価な製品の輸出による貿易摩擦、市場価格の撹乱︵例えば、鋼や製紙で中華人民共和国の輸出増により値崩れが警戒されている[77]︶が指摘されている。
また、経済成長に伴い資源の消費が増えるにつれ、資源輸出の抑制、輸入が急増している。石油はかつては輸出国だったが、今は輸入国に転じている。また、鉄鉱石、銅などの大口の輸入国でもある。レアメタルについては、中華人民共和国が供給における寡占状態の品目があり、中華人民共和国の態度が当該品目の価格を左右する状態にある︵例えばタングステンは、2005年5月に中華人民共和国が増値税の還付の引き下げを行った結果、価格が高騰、高止まりしている。中華人民共和国は経済成長により、レアメタルの供給側から消費側に転じていることが、価格の高騰をもたらしている[78]︶。以上のように、中華人民共和国の大量消費が国際価格の上昇の一因となっている。
著作権問題
編集詳細は「中国の知的財産権問題」を参照
かつては違法なコピー商品が散見していたが、国外からの批判や中国企業の技術成長により2010年代に入るとコピー商品は姿を減らしていった[79]。
品質問題
編集詳細は「中国製品の安全性問題」を参照
品質面においては、必ずしも品質が高いとはいえない製品の輸出︵これは過当競争による過剰生産が要因で、中華人民共和国国内で販売するよりも輸出した方が儲けられるとして、アフターサービスを満足に行えなくても輸出を行うことによる︶がある。
民族系企業の乗用車は品質だけでなく衝突安全性も低く、ドイツの民間機関やユーロNCAPによる衝突実験で民族系企業の複数の乗用車が過去最低の衝突安全性を記録し、その結果輸入販売代理店が既に販売された車の無償回収を行うなど波紋を広げている。これらの結果を受けた中華人民共和国当局は、﹁メイド・イン・チャイナのブランド低下﹂に繋がるとして、2007年3月より完成車の輸出を許可制にするとしている[80]︶。
またアメリカでは、アメリカ企業の中華人民共和国製のおもちゃに基準を超える鉛が含まれていたことが問題となり、販売元による回収が数度にわたり行われ社会問題になっている他、食料品においては、残留農薬などが危険な水準に達している食料品︵毒菜ともよばれる︶の輸出が問題になるケースがある。また医薬品についても医薬成分の偽装などによる死亡事例などが問題となっている。
輸入品への政治的対応
編集「中国のネット検閲」も参照
中華人民共和国は国内に報道規制がなされているため、輸入商品に欠陥が見つかると、必要以上に大きく報道し、損害賠償を求める一方で、輸出商品の欠陥が国内で報道されることはまれである。
また、こういった動きには政治的な思惑もあると報道される場合がある。
●浙江省でルイ・ヴィトンなどが焼却処分された際には、EUが2006年に中華人民共和国製革靴に対し反ダンピング税をかけたことに対する報復措置ではという見方がある[81]。
●日本から輸出されたアメリカのマックスファクター社の化粧品﹁SK-2﹂が品質問題により販売禁止になった際には、日本が2006年に輸入食料品への残留農薬規制を厳しくしたことに対する報復という見方があった。問題となった化粧品は、日本やアメリカでは問題なく販売されていた他、中華民国の行政院衛生署では﹁︵SK-IIから︶検出された金属成分は自然界に微量に含まれるもので衛生基準内にある﹂との検査結果を発表していた。しかし、安倍晋三首相の訪中が決定したことにより販売禁止は解除された[82]。
食品問題
編集詳細は「中国製品の安全性問題」を参照
食品に関する事故・事件が頻発していて、生産・製造者における食の安全管理の向上が課題となっている。
農村では、農作物の増産のため大量の農薬を使用しており、全世界や香港などで﹁毒菜﹂と呼ばれることがある。中華人民共和国国外においては、中華人民共和国産の農作物についてはEUでほうれん草などの野菜が輸入禁止対象となったことがある他、主要輸入国である日本が、2006年5月に残留農薬基準を超えた食品の販売を禁止するポジティブリスト制度を導入した際、6月の野菜輸入が前年同月比で約2割減少した。他には鰻が検査に引っかかった結果輸入が減り、日本国内での価格が高騰した事例がある。
農作物以外の加工食品については、工場の衛生管理が悪く不衛生であること、安全よりも利益を優先し危険な飼育法や薬品を使用していること、偽ブランドが横行していることを指摘されている。
食料自給率
編集
2019年版﹃中国の食糧安全保障白書﹄などで、中国政府は穀物自給率について﹁95%を超えている﹂と発表しているが、カロリーベースか生産額ベースかは明らかにしていない。日本の農林水産省による各国の食料自給率比較でも、中国はデータが不十分であるとして除外されている。国連食糧農業機関︵FAO︶統計を利用した愛知大学名誉教授高橋五郎による推計では、中国のカロリーベース食料自給率は2000年の94%から2010年は83%、2019年は78%前後、2020年は悪天候もあり76%前後に下がった。重金属などによる土壌汚染、過剰施肥による土壌劣化でも、農地の乱開発も進んでいる。このため習近平政権は食べ残し削減運動も展開しているが、飲料を含む食品輸入は増加傾向にあり、2019年は884億USドルと過去最多水準に達した[83]。
社会問題
編集- 農民の暴動問題
産業
編集第一次産業
編集
中国の農業生産高は世界2位︵2015年︶、第1次産業部門の実質経済成長率は2007年で前年比3.7%[84] の2兆8095億元[85] であるが第2次産業、第3次産業と比べて低成長である。
主要農作物として、米、コムギ、 ジャガイモ、 ピーナッツ、 茶、 キビ、 オオムギ、 綿花、 アブラナ、 ブタ、 魚類がある。中国政府は穀物自給率が95%と主張している[83]。
中国の労働者の半分弱が農業に従事しているが、耕地面積が国土の14%と限られている為、農業の生産性はアメリカ合衆国に比べてかなり低い。限られた農地で穀物を生産しており、米、じゃがいも、とうもろこし、黍、大麦、ピーナッツ、茶、豚肉の生産量は世界1位である。他の非食用の農作物として菜種、綿花などの繊維を生産している。果物や野菜、魚介類、肉類、穀物は香港に輸出されている。
農地の狭小さのために集約型農業を展開しているが、生産量増加の為に穀物貯蔵用倉庫や肥料の使用、科学技術の進展が望まれている。その一方、生産量増加のために利用する農薬などが国際的な安全基準を満たしていないという検査結果が日本などから発表され、低価格を武器に長ネギなどで日本市場での占有率を上げていた中国農業は痛手を受けた︵中国製品の安全性問題、中国産食品の安全性参照︶。
国際連合世界食糧計画によると、2003年において世界で耕作可能な土地のたった7%で、世界の20%を占める中国の人口は養われているということである[86]。
遺伝子組み換え作物については、政府が積極的に取り組んでいる。政府の研究費は、2003年で約2億ドル。栽培面積は360万ヘクタールで、世界第6位。主食である米については、中国では水不足が深刻なことから、水が少なくても栽培できる米の開発を目指している。米の認可はまだ下りてないものの試験栽培は行われており、試験栽培された遺伝子組み換え米が欧州や日本の米加工品市場に流れ、問題になったことがある[87]。
中国の豚肉生産量は2018年時に5500万トンであった[88]。
綿産業
編集「中国における綿生産」を参照
中国は世界最大の綿花生産国であり、世界のアパレル産業において大きな地位を有する。綿花は政府が全量買い上げでおり、直接輸出を行なっていないものの、中国で製造され、輸出されたアパレル製品に使用されており、中でも新疆ウイグル自治区の栽培された綿花は﹁新疆綿﹂として高評価を得ている。その一方、ウイグルの強制労働の疑惑が指摘されており、深刻な人権問題を孕んでいる[89]。
コーヒー産業
編集「中国におけるコーヒー生産」を参照
2021年の中国のコーヒー生産高は10万9,088トンで世界13位の規模を誇る世界的なコーヒー生産国である[90]。このうち、雲南省が国内生産量の98%を占めている[91]。
第二次産業
編集
中国の工業生産高は世界2位である︵2015年︶。第2次産業部門の実質経済成長率は2007年で前年比13.4%[84] の12兆1381億元[85] と中国経済を牽引している。主要産業として靴・衣服といった繊維製品、食品加工物といった軽工業から、石炭、石油および化学製品、鉄鋼、機械・兵器・自動車といった機械、家電製品・電話・パーソナルコンピュータといった電化製品、重化学工業まで存在する。
主要国有企業は、鉄、石炭、機械、軽工業、兵器、繊維である。これらの産業は1979年から1989年までの10年間において、会社経営の改革があまり進まなかった。
一方、電気機械、自動車、石油化学は最近急速な発展を示しており、とりわけ電気機械は中国の主要な輸出品となっており、2005年の中国の輸出高7619億USドルの内、3220億USドルを占めている[92]。
2007年の省内総生産において第2次産業が1兆元を超える省は、江蘇省︵1兆4285億元、省内生産における第2次産業の構成比55.9%、以下同じ︶、浙江省︵1兆92億元、54.1%︶、山東省︵1兆4773億元、57.1%︶、広東省︵1兆5938億元、52.0%︶と東部に集中している[93]。
鉄鋼
編集
中国の粗鋼生産量は世界1位である。経済成長に伴い、家電製品、自動車といった工業製品や不動産、インフラストラクチャーの建設による需要の増加に伴い、2007年の4億8966万トンから2018年の9億2826万トンと11年間で2倍近い生産量となった[94][95]。
中国には2020年世界1位の粗鋼生産量を持つ宝武鋼鉄集団[96]、3位河北鋼鉄集団、4位の江蘇沙鋼集団[96]、7位の馬鞍山鋼鉄、8位の建龍集団、9位の首鋼集団[96]、10位の山東鋼鉄集団等が存在する。
電気機器
編集この節の加筆が望まれています。 |
1978年の鄧小平・松下幸之助の会談[97] を嚆矢として、安価な労働力と10億人を越える巨大市場を狙い、日本の家電メーカー︵松下電器産業、日立製作所、東芝、三菱電機、ソニー、シャープ、三洋電機など︶や韓国のサムスン電子、LG電子、SKハイニックス、台湾のフォックスコン、コンパル・エレクトロニクス、クアンタ・コンピュータ、ペガトロンのようなEMS等が沿岸部を中心に工場を設立し、中国市場に参入していった。1990年代初めは日本ブランドが市場を席巻したが、後半になると、品質の向上、生産規模の拡大によるコスト削減、現地メーカーのサービス網・販売網の整備、家電製品の製造の垂直分裂により競争力が高まり、ハイアール、美的集団、長虹︵zh︶、TCL集団等といった現地メーカーが台頭してきた[98]。
また、情報機器分野では、レノボがIBMのパソコン部門を2004年12月に買収し、その後NECのパソコン部門も買収し、シェア世界一となってる。
自動車
編集自動車の生産
編集
2020年時点で、世界第1位の生産をほこる[99]。雇用面では、就業人口の6分の1が自動車及び関連企業で働いている[100]。
BMWなど外資系企業が多数進出しており、中国の生産工場はすべて中国企業との合弁会社が運営している。国産企業も多いが、零細企業が乱立している。零細企業の乱立は、質の低下や過剰生産を招いているため、政府は業界再編の方針を打ち出している[80]。国産企業の主な輸出先は、アフリカや東南アジアなどの途上国となっている[80]。
自動車の消費市場
編集
中国国内における市場規模は約2531万台。これは世界最大の規模である︵2020年時点︶[99]。
中国における販売台数は年々増加しているが、購入の主力層は時代とともに移り変わっている。当初は政府や企業が公用車として自動車を購入し、続いて富裕層が主役となった。その後、経済成長を背景とした所得の増加により、新たな中間層が自動車購入の主役となっている[101]。このため、先進国と違い中国における新車購入者は﹁初めて車を購入する人が多い︵購入者の6 - 7割は初めて車を購入する人︶﹂状況にある[101]。
2019年では販売された乗用車の内セダン48.1%、MPV6.5%、SUV43.6%であった[102]。
軽工業
編集靴
編集
2006年時点における生産量は100億足を超え、約8割が輸出されている。生産量は多いが
●零細企業が多い
●単価が安く、利益率が低い︵単価は約250円。利益率は約15%︶
●単価が安いため反ダンピングの対象となることが多く、マカオを経由した迂回輸出が行われている
ことが、業界の課題となっている[103]。
エネルギー及び天然資源
編集| エネルギー及び天然資源に関する統計 | ||
|---|---|---|
| 電気[5] | ||
| 生産量 | 5兆3880億kWh(2014年) | |
| 消費量 | 5兆5230億kWh(2014年) | |
| 輸出 | 182億kWh(2014年) | |
| 輸入 | 68億kWh(2014年) | |
| 電気生産のエネルギー源 | ||
| 化石燃料 | 67.3% | |
| 水力 | 22.2% | |
| 原子力 | 1.5% | |
| その他 | 9.0% | |
| 石油[5] | ||
| 生産高 | 4,278千バレル/日(2015年) | |
| 消費 | 11,120千バレル/日(2014年) | |
| 輸出 | 12千バレル/日(2014年) | |
| 輸入 | 6,167千バレル/日(2014年) | |
| 確認埋蔵量 | 247億バレル(2015年推定) | |
| 天然ガス[5] | ||
| 生産高 | 1235.0億m³(2014年推定) | |
| 消費 | 1811.0億m³(2014年推定) | |
| 輸出 | 26.1億m³ (2014年推定) | |
| 輸入 | 603.0億m³ (2014年推定) | |
| 確認埋蔵量 | 4兆9450億m³(2014年推定) | |
エネルギー消費量は2009年にアメリカを抜き世界最大となっている[104]。
中国は約15,000メガワット時の発電量を毎年増やすと期待されており、その20%は外国からの供給である。中国は環境問題の観点から発電するエネルギー源を現在の石炭から、石油や天然ガス、再生可能エネルギー、原子力発電へと変えようとしている。
中国は石炭の過剰生産を削減する為に1990年代後半から数万の炭鉱を閉鎖した[注釈7]。これにより石炭の生産量は1996年の13.97億トンから1998年の12.5億トンまで減少したが、2001年には減少前のほぼ同水準の13.81億トンにまで回復、2007年には経済成長も相俟って1996年の2倍近い25.36億トンであった[106]。
2020年の生産量は38億4000万トンと15年ぶりの高水準である[107]。
中国には大慶油田、勝利油田等の油田が存在するが、中国経済の発展に伴い1993年より中国は石油の純輸入国となった[108]。2020年の輸入量は1,085万バレルであった。2025年頃にピークアウトするとの見方が存在するが国内供給の減少など懐疑的な見方も存在する[109]。
中国は1998年の国有企業改革により、中国石油天然気集団公司、中国石油化工、中国海洋石油総公司の三社に再編された[110]。これら三社が高まる中国国内の石油需要に対応すべく石油利権の獲得に乗り出している。アフリカではダルフール紛争が起きたスーダン[110]、スーダンの隣国のチャド[110]、累積債務の返済について先進国と交渉している最中のアンゴラ[110]、アフリカ最大の原油産油国のナイジェリア[110] 等の国々が挙げられる。また、中国は中央アジアからの石油資源開発に乗り出しており、中国中信集団公司︵zh︶はカザフスタンの油田に投資してきている[111][112]。
中国政府はまた、天然ガスの増産にも積極的であり、第10次五カ年計画︵2001年~05年︶においては、2005年までに中国におけるエネルギー生産の2%から4%を天然ガスにする戦略が掲げられた。
中国政府はまた、エネルギー効率改善にも継続する意図を持ち、環境に悪影響を及ぼさない石炭利用技術︵en︶の利用を促進した。新しい石炭火力発電所の20%が1995年から2000年までの間に脱硫装置を取り付けた。再生利用可能なエネルギーへの関心は高まっているけれども、近い将来、水力発電を除いてエネルギー政策への転換をしてもエネルギー消費量を1~2%程度の上昇に抑える見込はない。
第一に︵長期間の融資を含む︶資金調達が困難なこと、第二に地方政府の保護主義に起因した市場の分断のせいで、効率的かつ大規模の発電所が建設が難しく、規模の経済が働かないことにより、中国のエネルギー部門の成長が妨げられている。
第三次産業
編集中国の商業・サービス業の生産高は世界第2位である(2015年)。第3次産業部門の実質経済成長率は2007年で前年比12.6%[84] の10兆53億元[85] である。
金融・保険
編集銀行業
編集証券業
編集中国にある二つの証券取引所(上海証券取引所と深圳証券取引所)の上場株式の時価総額は2007年1月、1兆ドルに達した。これは日本、香港に続きアジア3位の時価総額である[114]。
保険業
編集この節の加筆が望まれています。 |
情報・通信
編集
2020年6月末段階で、中国には4億6501万のブロードバンド回線があると推定されており普及率は31.3%[115]、99%以上のブロードバンド回線がFTTH/OでDSLが401万回線。
2020年時点での携帯電話普及率は120.4%、一方固定電話の普及率は減少傾向にある[115]。
問題点については﹁中国のネット検閲﹂﹁中華人民共和国国家情報法﹂を参照。
観光
編集「中国の観光」も参照
観光業は、世界でもトップクラスの規模を誇る。ただし、中国人のマナーの悪さなども指摘されている。
警備サービス
編集2011年時点で500万人でありインドの700万人についで多い。なお警察官は270万人であり1.8倍以上である[116]。
金融政策
編集貨幣制度及び為替レート
編集

中国の通貨単位は人民元であり、1元︵正確には圓︶=10角=100分となる。中央銀行は中国人民銀行である。
1994年、外国為替取引センターが設立され、為替レートが一本化された(﹁人民元の為替レートは、1990年代初めまでは社会主義国の例に漏れず、高めの公定レートと、実勢を反映した様々な市場レートに分かれていた。ただし、市場レートは次第に収斂し、﹁為替調整センター﹂で取引されるセンターレートと公定レートの二本立てになっていった。このセンターレートが大幅に下落し、一時は1ドル=11.2元にもなったが、介入もあって年末には8.7元にまで回復した。他方、公定レートも何度か切り下げられ、九四年初めには1ドル=5.8元になっていた﹂事を背景とする)。そして、1994年1月1日、中国人民銀行は銀行間外国為替市場における先日の為替レートに基づいたUSドル仲値を当日の基準為替レートとした。その結果、は8.28人民元/USドル近傍で推移していた。
2004年頃より、経済成長とともに、人民元が過小に評価されているという圧力が中国にかかってきた。そこで、2005年6月21日、温家宝首相は8.28人民元/1USドルから8.11人民元/USドルに切り上げるとともにドル・ペッグの固定相場制から、11の通貨による通貨バスケットとする変動相場制に移行した︵人民元改革︶。
こうして、2006年初めには8.07人民元/USドルに、2007年初めの人民元の為替レートは、7.75人民元/USドルとなっていった[117]。
2009年1月21日、バラク・オバマアメリカ合衆国大統領政権の財務長官に就任予定のティモシー・ガイトナーはアメリカ合衆国上院財務委員会での証言で以下の発言を行った。
様々なエコノミストの意見の結論に裏打ちされたバラク・オバマ大統領は、中国政府が為替を操作しているということを確信している。アメリカ合衆国大統領として、オバマ大統領はあらゆる外交政策を用いて積極的に中国の為替制度を変えようと誓っている[118][119]。
ガイトナーの発言に対し、中華人民共和国商務部は以下のように反論している。
我々中国政府は、国際貿易を有利に進める手段として為替操作を決して行っていない。また、輸出促進のために、人民元切り下げを行わない[119]。
キャッシュレス
編集
中国での電子決済は、銀聯カードの誕生がきっかけとなったと言われている。銀聯カードは異なる省や銀行間での決済の一本化を目的として、中国の中央銀行とされる中国人民銀行が設立した。2002年から発行を開始しており、電子決済の一つであるデビットカード付きの銀行カードである。当時の中国では低所得者の割合が高く、クレジットカードに必要とされる与信審査の通過が難しかったため、銀行口座を開設すれば入手可能な﹁銀聯カード﹂が普及した。
その後、紙幣の質が良くない、通貨インフラが整っていない、急速にスマートフォンが普及した事とスマホで完結する利便性からスマホ決済が2014年から急速に普及した。リープフロッグ型発展として知られている[120]。
クレジットカードの普及率は高くないがスマートフォンを利用したQR決済(電子決済普及率)が非常に高い。2019年の利用者数は6億210万人であり人口の半分近くであり、2020年には8億人を突破した[121]。現金を利用しない支払いが増えたことにより偽札の被害が大きく減った[122]。
中国は”電子経済大国”と呼ばれており、スーパーなどの買い物や、公共料金や医療費の支払い、レストランや屋台での会計がキャッシュレスで行われるだけでなく、お祝い金やお年玉などもデジタル化し、さまざまなものがモバイル決済で行われている。中国の電子決済のサービスとして、アリババグループの﹃アリペイ﹄、テンセントの﹃WeChat Pay﹄が二大勢力である。この二つのアプリが中国全体のモバイル端末での電子決済の約90%を占めている。どちらも中国で開設した銀行口座情報を紐付ければ、銀行口座から直接チャージすることができ、直接企業から個人、友人との間で金銭のやり取りを無料で行うことができる。
近年、飲食店ではレストランで着席したテーブルの上のQRコードをスキャンすれば、スマートフォン上にメニューが表示され、そこから注文、決済が完了するというシステムも増えている。
また、中国では2022年の北京冬季五輪を見据え、﹃デジタル人民元﹄の導入準備が行われている。中央銀行の発行する法定通貨では世界初となる。2014年、中国人民銀行(中央銀行)はデジタル元の研究に着手し、実証実験が行われてきた。
貿易
編集| 貿易統計 | ||
|---|---|---|
| 輸出金額 | 2兆2635億ドル(2017年) | |
| 主要輸出製品 | 機械設備、プラスチック、光学医療用機器、鉄鋼 | |
| 輸入金額 | 1兆8410億ドル(2017年) | |
| 主要輸入製品 | 機械設備、原油、プラスチック、光学医療用機器、有機化合物、鉄鋼 | |
2017年の輸出中国依存度
日本 (24.7%)
米国 (8.8%)
ドイツ (7.0%)
カナダ (5.1%)
フランス (4.3%)
イタリア (3.2%)
英国 (2.8%)
その他 (44.1%)
2017年の輸入中国依存度
日本 (21.1%)
米国 (16.3%)
カナダ (9.2%)
イタリア (7.0%)
ドイツ (7.0%)
英国 (5.9%)
フランス (5.1%)
その他 (28.4%)
中国の貿易額は2014年で4兆3000億ドルと見積もられている[123]。貿易額が初めて1兆ドルを突破したのは2004年︵1兆1500億ドル︶であり、2001年から3年間で2倍になった。
貿易黒字は2004年までは300億ドル台を維持していたが、2005年になって1000億ドルを突破した。その後は2007年に2000億ドル、2014年に3000億ドル、2015年には6000億ドルを突破している。
中国の主要貿易相手国はアメリカ合衆国、日本、大韓民国、ドイツ、シンガポール、マレーシア、ロシア、オランダ等である。対米貿易黒字が2004年には800億ドルに達し、翌年には1000億ドルを突破した[124]。アメリカ小売最大手のウォルマートが中国の第6位の顧客であり、イギリスをしのぐ金額になっている。貿易の活発に伴い中国の3つの港が、世界で最も忙しい上位五つの港に入っている。
中国は外国との貿易を地方に分散させようと試みている一方で、世界の貿易体制と統合しようと模索している。1991年11月、中国はAPECに加盟し、自由貿易及び経済・貿易・投資・科学技術の問題に関する協力を促進した。2001年には、中国はAPECの議長に就任し、上海ではAPEC首脳会議が開かれたのであった。
世界貿易機関加盟
編集
1999年、朱鎔基︵当時、首相︶はアメリカ合衆国を訪問し、二国間の農業協力協定 (Agricultural Cooperation Agreement) に署名した。この協定は、長年の間、中国への輸入を禁じていた柑橘類・穀物・牛肉・鶏肉を解禁するものであった。1999年11月、米中両国は、中国の世界貿易機関 (WTO) 加盟の下準備として二国間の市場参入協定 (bilateral market-access agreement) を結んだ。そして広範囲の貿易自由化協定の一部として、WTO参加後、中国政府は関税を引き下げ、市場にある障害を取り除く事を認めた。--例えば、中国や外国のビジネスマンは自分自身の商品を輸出入する権利を得、政府の仲介を通すこと無しに商品を売るといったことが挙げられる。--2004年にはアメリカ合衆国からの輸入農作物の平均関税率は31%から14%に引き下げられ、翌2005年には工業製品の関税が25%から9%に引き下げられた。この二国間協定は銀行、保険、通信といったサービス業にもまた認められた。欧州連合や他の国々との自由貿易協定締結後、2000年夏、中国は多国間のWTOの枠組みに入った。輸出が増えるにつれ、中国政府は、輸入した部品から輸出用の消費財を生産する外国資本の工場の速やかな発展を進めるといった政策を推進している。2001年12月11日中国はWTOに加盟した。
日中貿易
編集内閣官房日本経済再生総合事務局の分析によると、2017年時点、加工品と部品の中国依存度が最も高いのが日本である(右記のパイチャート参照)。輸出では集積回路、半導体、エンジンなど、輸入では電子部品、パソコン部品、自動車部品などが中国と依存関係が深い。
米中貿易
編集
アメリカ合衆国は発電所や飛行機及びその部品、コンピュータや産業機械、原材料、化学製品や農作物を中国に輸出する主要な供給国であるが、中国の制限貿易政策及びアメリカ合衆国の輸出規制より公正に市場参入出来るかに懸念を抱いている。中国における知的財産権侵害は、多くの日本や欧米企業を悩ませている問題である。日本や欧米の政治家や製造業者のいくらかは人民元が自国通貨よりも不当に安く、そのために人民元安が中国の輸出を有利にしていると主張している。アメリカ合衆国議会の中には、中国からの輸入品に27.5%の消費税を含めよといった保護貿易を後押ししようとしているものもいる。2015年にはカナダを抜いて中国は米国最大の貿易相手国となった[125]。
中露貿易
編集
1989年のミハイル・ゴルバチョフ・ソヴィエト連邦︵当時︶大統領の訪中で中ソ対立が終結してから、中露関係は好転した。特にロシアのウラジーミル・プーチン政権は中国を戦略的パートナーと見なし、上海協力機構の強化などにより中露間の貿易金額は2005年には前年比37.1%増の291億ドルに達した[124]。中国からロシアへの機械及び家電製品の輸出は70%成長を、ハイテク製品の輸出は58%成長を遂げ、中国からロシアへの輸出の割合は全体の7%を占めるようになった。また、2国間の国境貿易は、前年比35%増の51.3億ドルに達した。
ロシアは中国の第8の貿易相手国であり、中国はロシアの第4の貿易相手国である。そして、中国は今、ロシアに750以上のプロジェクトに投資しており、その金額は10億ドルになる。中国は2005年の1~9月の間に、前年比2倍の368百万ドルをロシアに投資した。2006年にはプーチンが中国を訪問し、同行した大規模な経済使節団が両国間の大型商談を次々とまとめたため、この額は今後も急増するとみられる。
ロシアから中国への輸入品は、原油—鉄道によりほとんどが運ばれるのだが—といったエネルギー資源や、シベリアや極東地域からの電気がある。ロシアは中国との国境付近に東シベリア-太平洋石油パイプラインを建設し、ロシアの独占企業UESが中国への電気の輸出の目的で水力発電所を建設するにつれ、遠くない将来、中露両国間の貿易量は増加へ向かうと予想されている。
外国投資
編集外資導入の流れ
編集
1989年、中国政府は外国人が優先度の高い部門や地域において投資することを促進する為の法整備を行った。それの1例が、外国人に様々な産業への投資をあるていど許可したEncouraged Industry Catalogue である。

深圳証券取引所
1990年、政府は合弁事業の設立における制限を撤廃し、国有化に対する保証を与え、外国企業が合弁企業の取締役会の議長になることを許可した。1991年、中国政府は外資が完全に所有する企業や国家が働きかけた経済特区やプロジェクト—エネルギー、通信、輸送といった分野—に投資をした企業への従来以上の税制優遇措置を与えた。中国政府はまた、外国の銀行に上海への支店開店を許可し、外国人投資家が、上海証券取引所や深圳証券取引所で"B"株を購入することを許した。2006年、中国は約695億ドルの外国から直接投資をうけた[126] 。
2020年には1630億ドルとアメリカを抜き直接投資額で首位となった[127]。
それでもやはり、中国から撤退する会社も存在する。例えば、中国において外資企業が合弁企業を管理するのを禁じた規制の結果、ワーナー・ブラザースは中国での映画ビジネスから撤退した。その規制は、中国での投資家は少なくとも51%の株を保有するか或いは合弁企業で主導的な役割を担うということを要求していた[128]。
2010年、Googleは、中国からサイバー攻撃を受けたとして、中国国内で言論の自由を脅かされていることを理由に中国事業から撤退した[129][130][131]が、2018年にはCEOが将来的な再参入を示唆するなど市場として大きさは無視できない程になっている[132]。

中国企業の海外進出
編集詳細は「走出去」を参照
環境
編集
中国の急速な経済成長は有害な副産物を生み出し、大気汚染、水質汚濁、土壌汚染をもたらしている。1998年、世界保健機関は大気汚染の程度を世界中の272の都市の中で発表し、上位10都市中7都市が中国の都市であるとしている。中国政府自身は338都市の2/3が大気汚染が深刻になっていると評価している。大気汚染と関連した呼吸系疾患や心臓疾患が中国の死因の上位になってきている[注釈9][注釈10]。
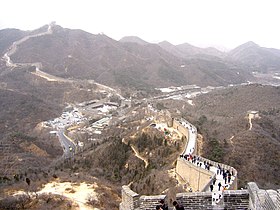
黄砂でかすむ万里の長城・八達嶺長城の遠景
砂漠化もまた、深刻な問題になっており、春先になるとタクラマカン砂漠、ゴビ砂漠、黄土高原より黄砂が大量に飛来し、人々の生活に影響を与えている。
中国共産党の指導者は環境問題に段々と注意を払ってきている。1998年3月、国家環境保護総局︵en︶は中華人民共和国国務院の部レベル︵日本の省レベルに相当︶まで格上げされた。2007年初め、国家環境保護総局は82のプロジェクトが環境影響評価法に違反しており、それらの投資金額は1123億元になっていることを発表した[136]。
近年、中国政府は環境に対する法制を強化し、環境の悪化を食い止めようとしている。1999年、中国政府はGDPの1%以上を環境保護に費やしており、その比率は年々増加している。第10次5カ年計画の間、中国政府は総排出量を10%削減しようとしたとりわけ2008年北京オリンピック開催を勝ち取る為の一環として、汚染防止に多くの投資を行った。
中国政府は気候変動についての話し合いや他の多国間の環境問題の話し合いに積極的に参加しており、また、バーゼル条約、モントリオール議定書、ワシントン条約等多くの条約を締結している。

三峡ダム
三峡ダム建設による環境へ与える衝撃については中国内外の環境保護主義者の間で議論が巻き起こった。建設反対派は土壌浸食や長江の沈泥がいくつかの絶滅危惧種を脅威に曝すと主張した。一方、中国政府は三峡ダム建設伴う水力発電所建設は地域での石炭使用量を減らし、結果として大気汚染が減るということを主張した。
アメリカ合衆国副大統領と中華人民共和国首相が共同で議長を務める環境と発展に関する米中フォーラムは、1997年から米中両国の環境への協力という積極的なプログラムである。このフォーラムがあるにもかかわらず、中国は対外援助が低い国であるアメリカのプログラムと、そうでない日本やEUとしばしば比較している。


マクロ経済のトレンド
編集この表は国際通貨基金による中国の各年のGDP(市場価格、単位百万元)の集計である[137][138]。
| 年 | GDP | USドル為替レート | 物価指数 (2000年=100) |
|---|---|---|---|
| 1955 | 91,000 | ||
| 1960 | 145,700 | ||
| 1965 | 171,600 | ||
| 1970 | 225,300 | ||
| 1975 | 299,700 | ||
| 1980 | 460,906 | 1.49元 | 25 |
| 1985 | 896,440 | 2.93元 | 30 |
| 1990 | 1,854,790 | 4.78元 | 49 |
| 1995 | 6,079,400 | 8.35元 | 91 |
| 2000 | 9,921,500 | 8.27元 | 100 |
| 2005 | 18,232,100 | 8.19元 | 106 |
購買力平価による比較だと、1ドルは2.05元に換算される。
香港及びマカオ
編集脚注
編集注釈
編集
(一)^ 農産物は1949年以前の生産量最高の年を100として比較すると、穀物109、綿花154、サトウキビ126、豚114、魚貝類111と軒並み回復した。同様に工業生産品も薄絹147、布137、鋼146、セメント125、発電量122となっている[44]。
(二)^ 1952年の実質GDPを100とすると1957年の実質GDPは155.6となり、平均すると年率![{\displaystyle 9.2\%(=({\sqrt[{5}]{\frac {155.6}{100}}}-1)*100)}](https://wikimedia.org/api/rest_v1/media/math/render/svg/3161dd5f508821ca678a49e6e0d63dc3d6dbe414) 成長している[47]。
(三)^ 1989年で消費者価格指数は118.0となっている[50]。
(四)^ 1978年から1988年までの11年間でGDPは毎年平均、名目ベース11%で経済成長をしていたが、1989年は4.1%、1990年は3.8%に鈍化し、1991年に9.2%に回復した[51]。
(五)^ 1998年の経済成長率は7.8%、1999年は7.6%だったが、2003年以降は10.0%台に回復している[51]。
(六)^ 但し、各地域の合計には中国人民解放軍の現役軍人は計上されていない[61]。
(七)^ 1995年に72,919あった郷鎮が運営していた炭鉱が、2004年には23,793にまで減少している[105]。
(八)^ 2004年段階で中国工商銀行18%︵5兆6705億元︶、中国銀行13%︵4兆2704億元︶中国農業銀行12%︵4兆0128億元︶、中国建設銀行12%︵3兆9009億元︶と4行の合計で55%となる[113]。
(九)^ 中国の都市における死亡原因のうち、心臓病が占める割合が17.89%で3位、呼吸系疾患が12.57%で4位に入っている[134]。
(十)^ 中国の農村における死亡原因のうち、心臓病が占める割合が11.77%で4位、呼吸系疾患が23.45%で1位に入っている[135]。
成長している[47]。
(三)^ 1989年で消費者価格指数は118.0となっている[50]。
(四)^ 1978年から1988年までの11年間でGDPは毎年平均、名目ベース11%で経済成長をしていたが、1989年は4.1%、1990年は3.8%に鈍化し、1991年に9.2%に回復した[51]。
(五)^ 1998年の経済成長率は7.8%、1999年は7.6%だったが、2003年以降は10.0%台に回復している[51]。
(六)^ 但し、各地域の合計には中国人民解放軍の現役軍人は計上されていない[61]。
(七)^ 1995年に72,919あった郷鎮が運営していた炭鉱が、2004年には23,793にまで減少している[105]。
(八)^ 2004年段階で中国工商銀行18%︵5兆6705億元︶、中国銀行13%︵4兆2704億元︶中国農業銀行12%︵4兆0128億元︶、中国建設銀行12%︵3兆9009億元︶と4行の合計で55%となる[113]。
(九)^ 中国の都市における死亡原因のうち、心臓病が占める割合が17.89%で3位、呼吸系疾患が12.57%で4位に入っている[134]。
(十)^ 中国の農村における死亡原因のうち、心臓病が占める割合が11.77%で4位、呼吸系疾患が23.45%で1位に入っている[135]。
- ^ China had a hundred million wealthy people (each owning a net wealth of over US$110,000) and the US 99 million. At US$63.8 trillion as of end of 2019, representing a 17-fold increase from US$3.7 trillion in 2001, the total amount of China's household wealth stood behind only that of the US with US$105.6 trillion.
出典
編集
(一)^ ab“概況・基本統計”. JETRO. 2022年7月10日閲覧。
(二)^ “Real GDP (purchasing power”. CIA. 2022年7月10日閲覧。
(三)^ “世界の一人当たりの購買力平価GDP(USドル)ランキング - 世界経済のネタ帳”. ecodb.net. 2023年9月13日閲覧。
(四)^ abcdefghijk“The World Factbook Economy”. CIA. 2022年7月10日閲覧。
(五)^ abcdCIAホームページ[リンク切れ]
(六)^ 三訂版,デジタル大辞泉, 日本大百科全書(ニッポニカ),旺文社世界史事典. “改革開放(かいかくかいほう)とは? 意味や使い方”. コトバンク. 2023年9月13日閲覧。
(七)^ “China central bank says will 'resolutely' curb big currency swings”. Reuters. (2022年10月11日)
(八)^ 小山 (2022年4月3日). “上海疫情冲击中国经济引擎 分析称习辗“上海帮”” (中国語). RFI - 法国国际广播电台. オリジナルの2022年4月5日時点におけるアーカイブ。 2022年4月3日閲覧。
(九)^ “习近平统治能力广受质疑” (中国語). RFI - 法国国际广播电台 (2022年5月23日). 2022年7月13日時点のオリジナルよりアーカイブ。2022年5月24日閲覧。
(十)^ “China's economy surpasses the European Union's for the first time” (英語). China's economy surpasses the European Union's for the first time. 2022年9月15日閲覧。
(11)^ Yao, Kevin; Cash, Joe; Cash, Joe (2023年4月18日). “China's economy gathers speed, global risks raise challenges to outlook”. Reuters
(12)^
—Xu, Chenggang.﹃The Fundamental Institutions of China’s Reforms and Development.﹄Journal of Economic Literature, vol. 49, no. 4, American Economic Association, 2011, pp. 1076–151, JSTOR 23071664.
—Nee, Victor, and Sonja Opper. "Political Capital in a Market Economy." Social Forces, vol. 88, no. 5, Oxford University Press, 2010, pp. 2105–32, JSTOR 40927540.
—Shue Tuck Wong & Sun Sheng Han (1998) Whither China's Market Economy? The Case of Lijin Zhen, Geographical Review, 88:1, 29–46, doi:10.1111/j.1931-0846.1998.tb00094.x
—Gregory C. Chow (2005) The Role of Planning in China's Market Economy, Journal of Chinese Economic and Business Studies, 3:3, 193–203, doi:10.1080/14765280500317866
—HUA, HUANG. "The Market Economy in China." Security Dialogue, vol. 24, no. 2, SAGE Publications, Ltd., 1993, pp. 175–79, JSTOR 44471339.
—Chow, Gregory C. "Development of a More Market-Oriented Economy in China." Science, vol. 235, no. 4786, American Association for the Advancement of Science, 1987, pp. 295–99, JSTOR 1698592.
(13)^ IMF Data and Statistics アーカイブ 2015年3月21日 - ウェイバックマシン
(14)^ “World Economic Outlook Database October 2022”. www.imf.org. 2022年4月19日閲覧。
(15)^ “Global Economy Watch - Projections > Real GDP / Inflation > Share of 2016 world GDP”. PWC. 2017年6月23日閲覧。
(16)^ Tang, Frank; Wang, Orange (2022年1月18日). “China GDP growth slows as population crisis, Covid-19 cloud economic outlook” (英語) 2022年8月14日閲覧。
(17)^ Cox, Wendell (2015年9月21日). “500 YEARS OF GDP: A TALE OF TWO COUNTRIES”. New Geography. 2020年9月4日閲覧。
(18)^ “China's Free Trade Agreements”. 2009年7月12日時点のオリジナルよりアーカイブ。2011年4月25日閲覧。
(19)^ “intracen.org”. 2014年10月30日時点のオリジナルよりアーカイブ。2023年5月12日閲覧。
(20)^ “China's share of global gross domestic product (GDP) adjusted for purchasing-power-parity (PPP)”. Statista. 2023年5月12日閲覧。
(21)^ “The Global Financial Centres Index 28”. Long Finance (2020年9月). 2020年9月26日閲覧。
(22)^ “Top 10 Largest Stock Exchanges in the World By Market Capitalization” (英語). ValueWalk (2019年2月19日). 2019年11月28日閲覧。
(23)^ “China: Fastest Growing Consumer Market in the World”. IMF direct – The IMF Blog. 2013年12月2日時点のオリジナルよりアーカイブ。2013年12月8日閲覧。
(24)^ Baffes, John; Kabundi, Alain Ntumba; Nagle, Peter Stephen Oliver; Ohnsorge, Franziska Lieselotte (2018-06-26). “The role of major emerging markets in global commodity demand” (英語). Policy Research Working Paper Series 2023年5月12日閲覧。.
(25)^ Higgins, Tucker (2021年1月24日). “China surpasses U.S. as largest recipient of foreign direct investment during Covid pandemic”. CNBC 2021年3月18日閲覧。
(26)^ Tjan, Sie Tek (2020年9月18日). “China's outbound foreign investment posts modest Decline since Start of 2020”. China Banking News 2020年10月16日閲覧。
(27)^ Zhao, Suisheng (2023). The dragon roars back : transformational leaders and dynamics of Chinese foreign policy. Stanford, California: Stanford University Press. pp. 219–220. ISBN 978-1-5036-3088-8. OCLC 1331741429
(28)^ “China Is Set to Keep Minting New Millionaires Faster Than U.S.”. Bloomberg.com. (2018年10月18日) 2019年2月19日閲覧。
(29)^ “China's Economy Is Catching Up to the U.S.”. オリジナルの2018年3月17日時点におけるアーカイブ。 2018年3月8日閲覧。
(30)^ “Trade recovery expected in 2017 and 2018, amid policy uncertainty”. Geneva, Switzerland: World Trade Organization (2017年4月12日). 2017年7月3日時点のオリジナルよりアーカイブ。2017年6月22日閲覧。
(31)^ Tjan, Sie Tek (2020年12月24日). “China surpasses the US in Wealth of Top 10%”. The US News & World Report 2020年10月20日閲覧。
(32)^ “China Widens Lead as World's Largest Manufacturer”. thomasnet.com. 2013年7月27日時点のオリジナルよりアーカイブ。2013年8月25日閲覧。
(33)^ “11-5 Value of Imports and Exports by Country (Region) of Origin/Destination 2022”. General Administrations of Customs of China. 2023年5月12日閲覧。 [1]
(34)^ * Bijun Wang & Xiang Li (2017) From world factory to world investor: the new way of China integrating into the world, China Economic Journal, 10:2, 175-193, doi:10.1080/17538963.2017.1320047
●Chen Li, Mee Kam Ng, Yuanzhou Tang & Tung Fung (2022) From a ‘World Factory’ to China’s Bay Area: A Review of the Outline of the Development Plan for the Guangdong-Hong Kong-Macao Greater Bay Area, Planning Theory & Practice, 23:2, 310-314, doi:10.1080/14649357.2021.1958539
●Mees, H. (2016). China as the World’s Factory. In: The Chinese Birdcage. Palgrave Macmillan, New York. doi:10.1057/978-1-137-58886-9_3
●Yuwan Duan and Erik Dietzenbacher and Bart Los and Cuihong Yang (2021). “How much did China's emergence as "the world's factory" contribute to its national income?”. China Economic Review 69: 101658. doi:10.1016/j.chieco.2021.101658. ISSN 1043-951X.
(35)^ Dutta, Soumitra; Lanvin, Bruno; Wunsch-Vincent, Sacha; León, Lorena Rivera; World Intellectual Property Organization (2022) (英語). Global Innovation Index 2022 – Which are the most innovative countries. Global Innovation Index. World Intellectual Property Organization. doi:10.34667/tind.46596. ISBN 9789280534320 2022年9月29日閲覧。
(36)^ Dominik, Boddin (2016). The Role of Newly Industrialized Economies in Global Value Chains. International Monetary Fund
(37)^ “China Becomes Top Filer of International Patents in 2019 Amid Robust Growth for WIPO's IP Services, Treaties and Finances”. World Intellectual Property Organization (2020年4月7日). 2020年4月7日閲覧。
(38)^ Emma Farge (2021年3月2日). “China extends lead over U.S. in global patents filings, U.N. says”. Reuters. 2021年3月2日閲覧。
(39)^ “Allianz Global Wealth Report 2021”. 2022年3月5日閲覧。
(40)^ Dutta, Soumitra; Lanvin, Bruno; Wunsch-Vincent, Sacha; León, Lorena Rivera; World Intellectual Property Organization (2022) (英語). Global Innovation Index 2022: Switzerland, the U.S., and Sweden lead the Global Innovation Ranking; China Approaches Top 10. Global Innovation Index. World Intellectual Property Organization. doi:10.34667/tind.46596. ISBN 9789280534320 2022年9月29日閲覧。
(41)^ “The Global Competitiveness Report 2018”. 2018年10月17日時点のオリジナルよりアーカイブ。2018年10月17日閲覧。
(42)^ “官方储备资产 (Official reserve assets)”. 2020年10月29日閲覧。
(43)^ World Bank. “China Country Climate and Development Report”. 2022年10月10日閲覧。
(44)^ 天児[2004] pp.109-111
(45)^ “Official Measures of Industrial Output in Current Prices, China 1952-96” (pdf). 2008年5月12日閲覧。
(46)^ Current GDP per capita
(47)^ 国家統計局国民経済綜合統計司編 (2009) p.12 表1-9 国内生産総値指数
(48)^ “China's middle class overtakes US as largest in the world”. デイリー・テレグラフ (2015年10月14日). 2016年8月17日閲覧。
(49)^ Deng Xiaoping on BUILD SOCIALISM WITH CHINESE CHARACTERISTICS on June 30, 1984 Archived 2010年2月10日, at the Wayback Machine.
(50)^ ab中華人民共和国国家統計局﹃中国統計年鑑2006年版﹄表9-1︵各種価格指数︶
(51)^ ab中華人民共和国国家統計局﹃中国統計年鑑2006年版﹄表3-3︵GDP指数︶
(52)^ "China's National Bureau of Statistics "
(53)^ “"China Is a Private-Sector Economy"”. BussinessWeek (2005年8月22日). 2010年3月25日時点のオリジナルよりアーカイブ。2007年3月27日閲覧。
(54)^ "Rise of a New Power," U.S. News and World Report June 20, 2005
(55)^ John Bryan Starr. Understanding China: A Guide to China's Economy, History and Political Structure.
(56)^ “中国の1人当たりGDP、あとわずかで﹁高所得国﹂入り”. JETRO. 2022年7月10日閲覧。
(57)^ “経済規模、中国が米抜き年内にも1位 購買力平価換算で世銀”. 日経新聞. 2021年9月9日閲覧。
(58)^ “米国をGDPで抜いた中国、すでに先進国家なのか?”. ブルームバーグ. 2021年9月9日閲覧。
(59)^ ﹁中国では6億人の月収が千元︵1万5000円︶﹂中国首相発言にネット沸く 東京新聞 TOKYO Web︵2020年6月2日配信︶2021年4月30日閲覧
(60)^ ab中華人民共和国国家統計局﹃中国統計年鑑2017年版﹄表3-9地区生産総値︵2016年︶
(61)^ 中華人民共和国国家統計局﹃中国統計年鑑2017年版﹄表2-6地域別年末人口数
(62)^ 中華人民共和国国家統計局﹃中国統計年鑑2006年版﹄2-3 国民経済和社会発展総量与速度指標
(63)^ 李先念のスピーチ, published in Hong Kong newspaper Ming Pao on June 14, 1979.
(64)^ “若者の失業率、公表停止 事前予想は過去最高―中国”. 時事ドットコム (2023年8月15日). 2023年8月16日閲覧。
(65)^ 英語版は "Help Wanted: China Finds Itself With a Labor Shortage" の記事を元にして書いている。
(66)^ "Labor Shortage in China May Lead to Trade Shif" の記事を元に書いている。
(67)^ "China Drafts Law to Boost Unions and End Labor Abuse" New York Times, October 13, 2006
(68)^ "Official Union in China Says All Wal-Marts Are Organized" New York Times October 13, 2006
(69)^ ab※記事名不明※﹃日本経済新聞﹄朝刊2007年10月19日 第13版
(70)^ 副島隆彦﹃あと5年で中国が世界を制覇する﹄ビジネス社、2009年8月28日。ISBN 978-4828415284。
(71)^ ab弘兼憲史・清水美和・阿古智子 (2011年2月5日). “中国を語ろう”. 週刊現代 (講談社)
(72)^ “中国の人口、13億4100万人に 2010年国勢調査速報”. AFP. (2011年2月28日). オリジナルの2020年9月29日時点におけるアーカイブ。
(73)^ 朴漢濟 (2020年9月18日). “︽大唐帝國的遺產︾‥中華人民共和國的繼承與﹁中華民族﹂的真相”. 関鍵評論網. オリジナルの2021年12月18日時点におけるアーカイブ。
(74)^ “農民工人口、再び増加に転じる、高齢化も進展”. JETRO. 2022年7月10日閲覧。
(75)^ 中野剛志、柴山桂太﹃グローバル恐慌の真相﹄集英社︿集英社新書﹀、2011年12月16日、145-146頁。ISBN 978-4087206203。
(76)^ ︻強権の中国︼共存の終わり(1)高圧外交、身構える世界/軍事力、30年代半ば 米に並ぶ/130か国﹁最大貿易相手﹂﹃日本経済新聞﹄朝刊2020年10月13日︵1面︶2021年1月17日閲覧
(77)^ 産経ニュース︵2006年11月6日付配信︶※記事名不明
(78)^ レアメタルシリーズ︵3︶レアメタルの供給構造の脆弱性︵タングステンにみる中国の影響︶独立行政法人石油天然ガス・金属鉱物資源機構︵JOGMEC︶金属資源情報センター※本文はネット掲載なし※
(79)^ “﹁パクリ大国﹂から真の﹁技術大国へ﹂ 知的財産権保護を強化する中国”. AFP. 2021年10月10日閲覧。
(80)^ abc﹁完成車輸出、許可制に3月から、品質・サービスなど条件﹂フジサンケイビジネスアイ︵2007年1月25日配信︶
(81)^ 産経ニュース︵2007年1月23日配信︶※記事名不明※
(82)^ ﹃読売新聞﹄2006年10月24日付配信※記事名不明
(83)^ ab﹁中国、逃げ水の食料自給 昨年7割台に低下の試算 農地劣化や乱開発要因﹂﹃日本経済新聞﹄朝刊2021年4月5日︵国際面︶2021年4月30日閲覧
(84)^ abc中華人民共和国国家統計局編[2008]p.22 国内生産総値指数︵一︶
(85)^ abc中華人民共和国国家統計局編[2008]pp.19-20 国内総収入和国内生産総値︵一︶
(86)^ WFPホームページ Archived 2005年10月25日, at the Wayback Machine.
(87)^ ﹁中国 遺伝子組み換え作物で積極政策﹂産経ニュース︵2007年10月28日配信︶
(88)^ “農業科学院が豚肉需給予測を発表︵中国︶”. 農畜産業振興機構. 2020年3月3日閲覧。
(89)^ “﹁新疆綿﹂はなぜ中国たたきの理由になったのか?”. 東方新報 (AFP BP news). (2021年4月8日) 2021年4月28日閲覧。
(90)^ “︻カフェビジネス最前線︼ 中国で人気広がる 雲南コーヒーとは”. NNA ASIA (2023年10月12日). 2023年10月12日閲覧。
(91)^ “Coffee brings prosperity to Yunnan farmers”. China Daily. (2017年12月15日) 2017年12月15日閲覧。
(92)^ 中華人民共和国国家統計局﹃中国統計年鑑2006年版﹄表18-7︵輸出入貨物分類金額︶
(93)^ 中華人民共和国国家統計局[2008]pp.30-32 地区生産総値及び増加速度
(94)^ “2018年の粗鋼生産量は史上最高の9億トン台、前年比6.6%増”. JETRO. 2019年3月26日閲覧。
(95)^ 中華人民共和国国家統計局[2008]p.129、主要工業産品産量︵四︶
(96)^ abc“Top steel-producing companies 2020”. 世界鉄鋼協会. 2021年10月10日閲覧。
(97)^ “松下幸之助の生涯‥152. 中国を訪問 1979年︵昭和54年︶”. 2007年12月2日時点のオリジナルよりアーカイブ。2008年8月2日閲覧。
(98)^ 丸川[2007]pp.3-23
(99)^ ab“世界生産・販売・保有・普及率・輸出”. 日本自動車工業会. 2022年7月10日閲覧。
(100)^ ﹃伸び続ける自動車産業、6人に1人が関連企業に就職﹄9月23日付配信 Record China
(101)^ ab田原真司﹁中国自動車市場、1000万台へ マイカーブームに底堅さ、北京オリンピック後は業界再編も﹂日経ビジネスオンライン︵2008年2月27日付配信︶
(102)^ “2――中国自動車市場の規模”. ニッセイ基礎研究所. 2021年9月17日閲覧。
(103)^ ﹁100億足生産の憂鬱、利益薄に悩む靴業界﹂NNA︵2007年8月29日付配信︶
(104)^ “2.エネルギー情勢”. 石油天然ガス・金属鉱物資源機構. 2021年9月17日閲覧。
(105)^ 堀井[2006]p.113
(106)^ 中華人民共和国国家統計局[2008]p.129、主要工業産品産量︵三︶
(107)^ “20年の中国石炭生産、38.4億トン 15年以来の高水準=国家統計局”. ロイター通信. 2021年9月17日閲覧。
(108)^ “WEO 2007 Fact Sheet - China”. 2008年6月15日時点のオリジナルよりアーカイブ。2008年7月26日閲覧。
(109)^ “中国の石油における存在感”. 石油天然ガス・金属鉱物資源機構. 2021年9月17日閲覧。
(110)^ abcde柴田[2007] pp.157-165
(111)^ ﹃週刊ダイヤモンド﹄2008年5月3日/10日合併号
(112)^ “中国中信集団、19.1億ドルでカナダの石油会社を買収︵2006年12月31日︶”. 新華社. 2008年7月19日閲覧。
(113)^ 柯[2007]p.11
(114)^ “Chinese stock market pushes above $1 trillion mark”. 2008年3月30日時点のオリジナルよりアーカイブ。2008年5月12日閲覧。
(115)^ ab“中国︵最終更新‥令和2年度︶”. 総務省. 2021年4月8日閲覧。
(116)^ “世界の民間警備員数、警官を上回る 国際調査”. AFP. 2021年9月9日閲覧。
(117)^ 中華人民共和国国家統計局﹃中国統計年鑑2006年版﹄表18-2︵為替レート︶
(118)^ “FINANCE COMMITTEE QUESTIONS FOR THE RECORD January 21, 2009”. 2009年1月24日閲覧。
(119)^ ab“Chinese Ministry Denies Geithner's Currency Claims”. 2009年1月24日閲覧。
(120)^ “中国でキャッシュレス化が爆発的に進んだワケ”. ウェッジ. 2020年3月4日閲覧。
(121)^ “キャッシュレス元年の日本でQRコード決済は普及するか”. ジェトロ. 2020年3月3日閲覧。
(122)^ “現金NGが当たり前、激変する中国﹁決済実情﹂”. 東洋経済. 2020年3月4日閲覧。
(123)^ 中国、貿易総額の伸び目標未達…労賃高騰などで[リンク切れ] 2015年1月13日
(124)^ ab中華人民共和国国家統計局﹃中国統計年鑑2006年版﹄表18-8︵各国︵地域別︶税関ベースの貨物輸出入総額︶
(125)^ 中国、米国最大の貿易相手国に=9月の対中貿易赤字は過去最多―米商務省
(126)^ “アーカイブされたコピー”. 2007年10月13日時点のオリジナルよりアーカイブ。2012年2月28日閲覧。
(127)^ “中国、米国抜き世界最大の海外直接投資受け入れ国に 2020年国連調査”. AFP. 2021年9月17日閲覧。
(128)^ Warner Bros to withdraw from Chinese mainland (Xinhuanet.com, with source from China Radio International)
(129)^ “米グーグル、昨年のサイバー攻撃で中国事業からの撤退検討”. ロイター (2010年1月13日). 2010年3月6日閲覧。
(130)^ “Google、中国から撤退か Google.cn 閉鎖の可能性も” (2010年1月13日). 2010年3月6日閲覧。
(131)^ “Google、中国からの大型サイバー攻撃に中国市場撤退も” (2010年1月13日). 2010年3月6日閲覧。
(132)^ “グーグル社員が抗議声明、中国での検索再参入に反発”. 日経新聞. 2021年9月17日閲覧。
(133)^ “更好地実施“走出去”戦略”. 中華人民共和国中央人民政府 (2006年3月15日). 2010年2月20日閲覧。[リンク切れ]
(134)^ 中華人民共和国国家統計局﹃中国統計年鑑2006年﹄表22-34 城市前十位疾病死亡原因及構成 (2005年)
(135)^ 中華人民共和国国家統計局﹃中国統計年鑑2006年﹄表22-35 農村前十位疾病死亡原因及構成 (2005年)
(136)^ 中外対話ホームページ
(137)^ http://www.imf.org/external/pubs/ft/weo/2006/01/data/dbcselm.cfm?G=2001
(138)^ http://www.chinability.com/GDP.htm
参考文献
編集
●天児慧﹃中国の歴史11巨龍の胎動﹄講談社、2004年。ISBN 4-06-274061-3。
●柯隆﹃中国の不良債権問題﹄日本経済新聞出版社、2007年。ISBN 978-4-532-35276-9。
●黒田東彦﹃元切り上げ﹄日経BP社、2004年。ISBN 4-8222-4379-6。
●柴田明夫﹃エネルギー争奪戦争﹄PHP研究所、2007年。ISBN 978-4-569-69220-3。
●堀井伸浩﹁第5章 エネルギー需給安定化に向けた課題﹂、2006年。︵大西康雄 編﹃中国胡錦濤政権の挑戦﹄アジア経済研究所、2006年。ISBN 4-258-30001-2。︶
●丸川知雄﹃シリーズ現代中国経済3労働市場の地殻変動﹄名古屋大学出版会、2002年。ISBN 4-8158-0443-5。
●丸川知雄﹃現代中国の産業﹄中央公論新社、2007年。ISBN 978-4-12-101897-7。
統計
●中華人民共和国国家統計局ホームページ
●中華人民共和国国家統計局﹃中国統計摘要2008﹄中国統計出版社、2008年。ISBN 978-7-5037-5484-5。
●国家統計局国民経済綜合統計司﹃新中国六十年統計資料匯編﹄中国統計出版社、2009年。ISBN 978-7-5037-5894-2。
関連項目
編集外部リンク
編集