Jump to content


Main menu


Navigation  


Main page
Contents
Current events
Random article
About Wikipedia
Contact us
Donate


Contribute  


Help
Learn to edit
Community portal
Recent changes
Upload file


Search  


Create account

Log in


Create account
 Log in


Pages for logged out editors learn more  


Contributions
Talk


Contents


(Top)


1History


2About


3See also


4References


5External links


Violin plot


فارسی
Italiano

Norsk bokmål
Português
Shqip
Українська
 

Edit links


Article
Talk


Read
Edit
View history


Tools


Actions  


Read
Edit
View history


General  


What links here
Related changes
Upload file
Special pages
Permanent link
Page information
Cite this page
Get shortened URL
Download QR code
Wikidata item


Print/export  


Download as PDF
Printable version


In other projects  


Wikimedia Commons


From Wikipedia, the free encyclopedia


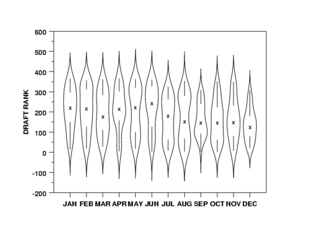
Example of a violin plot
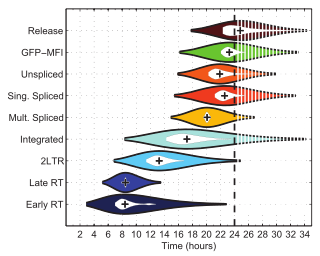
Example of a violin plot in a scientific publication in PLOS Pathogens.

Aviolin plot is a statistical graphic for comparing probability distributions. It is similar to a box plot, with the addition of a rotated kernel density plot on each side.[1]

History[edit]

The violin plot was proposed in 1997 by Jerry L. Hintze and Ray D. Nelson as a way to display even more information than box plots, which were created by John Tukey in 1977.[2] The name comes from the plot's alleged resemblance to a violin.[2]

About[edit]

Violin plots are similar to box plots, except that they also show the probability density of the data at different values, usually smoothed by a kernel density estimator. A violin plot will include all the data that is in a box plot: a marker for the median of the data; a box or marker indicating the interquartile range; and possibly all sample points, if the number of samples is not too high.

While a box plot shows a summary statistics such as mean/median and interquartile ranges, the violin plot shows the full distribution of the data. The violin plot can be used in multimodal data (more than one peak). In this case a violin plot shows the presence of different peaks, their position and relative amplitude.

Like box plots, violin plots are used to represent comparison of a variable distribution (or sample distribution) across different "categories" (for example, temperature distribution compared between day and night, or distribution of car prices compared across different car makers).

A violin plot can have multiple layers. For instance, the outer shape represents all possible results. The next layer inside might represent the values that occur 95% of the time. The next layer (if it exists) inside might represent the values that occur 50% of the time.

Violin plots are less popular than box plot. Violin plots may be harder to understand for readers not familiar with them. In this case, a more accessible alternative is to plot a series of stacked histograms or kernel density plots.

The original meaning of "violin plot" was a combination of a box plot and a two-sided kernel density plot.[1] However, currently "violin plots" are sometimes understood just as two-sided kernel density plots, without a box plot or any other elements.[3][4]

See also[edit]

References[edit]

  1. ^ a b "Violin Plot". NIST DataPlot. National Institute of Standards and Technology. 2015-10-13.
  • ^ a b Hintze, Jerry L.; Nelson, Ray D. (May 1998). "Violin Plots: A Box Plot-Density Trace Synergism". The American Statistician. 52 (2): 181–184. doi:10.1080/00031305.1998.10480559. ISSN 0003-1305.
  • ^ Wilke, Claus O. Fundamentals of Data Visualization.
  • ^ "Violin plot — geom_violin". ggplot2.tidyverse.org. Retrieved 2023-11-19.
  • External links[edit]

    Public Domain This article incorporates public domain material from Dataplot reference manual: Violin plot. National Institute of Standards and Technology.


    Retrieved from "https://en.wikipedia.org/w/index.php?title=Violin_plot&oldid=1223737805"

    Category: 
    Statistical charts and diagrams
    Hidden categories: 
    Articles with short description
    Short description matches Wikidata
    Commons category link is on Wikidata
    Wikipedia articles incorporating text from the National Institute of Standards and Technology


    This page was last edited on 14 May 2024, at 01:03 (UTC).

    Text is available under the Creative Commons Attribution-ShareAlike License 4.0; additional terms may apply. By using this site, you agree to the Terms of Use and Privacy Policy. Wikipedia® is a registered trademark of the Wikimedia Foundation, Inc., a non-profit organization.


    Privacy policy

    About Wikipedia

    Disclaimers

    Contact Wikipedia

    Code of Conduct

    Developers

    Statistics

    Cookie statement

    Mobile view


    Wikimedia Foundation
    Powered by MediaWiki