
鉄道貨物輸送
(宅扱いから転送)


| 鉄道輸送 |
|---|
|
|
| 鉄道施設 |
|
|
| 車両とサービス |
|
|
| 特殊線 |
|
|
| その他 |
|
|
鉄道貨物輸送︵てつどうかもつゆそう、Rail freight transport︶とは、鉄道列車を人の乗客ではなく、貨物を輸送するために使用すること。鉄道旅客輸送と対義され、両者を共に行うことは貨客混載と呼ばれる。
貨物列車とは、1台以上の機関車によって牽引される貨車編成をさし、荷主と配送先の間の全行程または一部において、貨物輸送を担う物流チェーンの一部として目的地に届けられる。貨車には、ばら積み車、インターモーダル貨物コンテナ、一般貨物車、特殊貨物輸送のための専用車などが用いられる[1]。鉄道貨物の慣行と経済状況は国や地域によって異なる。
輸送重量当たりのエネルギー消費量を考慮すると、鉄道輸送は他の輸送手段よりも効率的である場合が多い。一般的に最も経済性が高いのは、ばら積み貨物︵石炭など︶を積載し、長距離を輸送する場合である。しかし、鉄道による輸送は高速道路ほど柔軟ではないため、現状では長距離であっても多くの貨物がトラックで輸送されている。しかし荷送人が鉄道に直接アクセスできない場合、積替えコストが掛かることが多い。これらのコストは列車自体の運行コストを超える可能性があり、このコストを抑えるためにコンテナ化やピギーバック輸送などが試みられている。
歴史[編集]
鉄道が発明される前、人力や馬車より貨物を大量輸送できる交通機関としては船︵水運︶が使われたが、内陸部では流れが穏やかな河川の中下流部や運河、湖以外は運航できない制約があった。鉄道の実用化により、船が通れない地域でも輸送網を作り上げることが可能となり、産業革命後、大いに発展することとなった。
鉄道車から荷馬車への積み替え(英国スウィンドン蒸気博物館)

貨物ヤードでの貨車組み換え
鉄道が陸上交通の主力であった時代は、貨物輸送を主目的として開業する鉄道会社・線区や、鉱山・工場・建設現場などへの専用鉄道も多かった。大手荷主は鉄道線路の近くに工場や倉庫を建て、自社敷地内に引き込み線と呼ばれる線路を通し、そこで商品を鉄道車両に積み降ろししていた︵車扱貨物︶。他の荷主は荷車やトラックによって、貨物ヤードに商品を搬入していた︵ドレージ輸送︶。貨車は引き込み貨物駅から貨物ヤードまで、小型機関車により移送された。その目的地に応じて、貨物車らは長距離列車のいずれかに連結された。長距離輸送となると貨物車は複数のヤードを渡り歩き、何度も連結先が変更された︵ヤード継走式輸送︶[2]。
こういった作業を踏むため、これまで鉄道輸送は遅くコストが増加していた。そのため貨物鉄道事業者はコンテナ化やブロックトレイン︵直行型列車︶などの技術を通じて、ヤード切離し作業をを削減・廃止することでコストの削減を進めており、日本を含めた一部の国ではこれらの方式が、ヤード継走式に完全に取って代わってきている[3][2]。
鉄道輸送の利点は、連結する貨車を増やせば大量輸送が可能となることであった。半面、貨物の出発地や最終目的地が鉄道沿線でない場合、自動車などと組み合わせる必要がある。同時に時間における柔軟性を欠くことでもあった。政策的な自動車道路網の整備によるモータリゼーションの発展とトラックの性能向上により、鉄道を利用する貨物輸送はきめの細かい貨物輸送の手段としては価値を減じた。近年は大気汚染や地球温暖化の深刻化などを受け、企業は環境保護の取り組みが社会的に要求されるようになったことから環境負荷の低い鉄道貨物輸送を見直すモーダルシフトの動きが出ている。
輸送コスト[編集]
| 輸送方法 | ユーロセント/トンキロ |
|---|---|
| 道路 (小型車) | 35.6
|
| 道路 (大型車) | 4.2
|
| 鉄道 (ディーゼル) | 1.8
|
| 鉄道 (電化) | 1.1
|
| 内陸水運 | 1.9
|
「持続可能な輸送」も参照
鉄道輸送は非常にエネルギー効率が高く、道路輸送よりもはるかに環境に優しい[4][5]。トラックによる道路輸送と比較して、鉄道輸送では複数トラックで輸送する商品量が1回の輸送で確実に輸送される。これにより輸送にかかるコストを大幅に節約できる[6] 。さらに鉄道貨物輸送では外部コストも非常に低くなる[4]。したがって多くの政府は、環境上の利点を理由に、トラックから鉄道貨物への切り替えを促進している︵モーダルシフト︶[4][5]。鉄道輸送と内陸水運も同様に環境に優しい輸送手段であり、どちらも 2019年欧州グリーンディールの主要部分を占めている[4]。
大陸や国土が広い国では、重量が大きい貨物を遠方へ安く運ぶ陸送する手段として活用され続けており、技術改良も進められている。オーストラリアでは、資源企業リオ・ティント社が2018年、採掘した鉄鉱石を自律運行の無人貨物列車で鉱山から港まで運ぶ試みに成功した[7]。
ばら積み[編集]

詳細は「ばら積み貨物」を参照
ばら積み貨物は、ほとんどの貨物鉄道で輸送されるトン数の大部分を占めている。ばら積み貨物とは、梱包されていない状態で大量に輸送される商品・貨物である。これらの貨物は通常、注ぎ口やパワーシャベルによって、液体または固体として鉄道車両に投下・注入される。石油や化学薬品などの液体や圧縮ガスは、タンク車で運ばれる[8]。
ホッパ車は、石炭、鉱石、穀物、トラックバラストなどのドライバルク商品を輸送するために使用される貨車である。この種類の車両は、荷物を降ろすために下面または側面に開閉ドアがある︵有蓋車︶という点で、無蓋車と区別される。ホッパ車の開発は、自動積み下ろし設備を備えた、ばら積み品の自動取扱い方法の開発と並行して行われた。ホッパ車には主に二種類のタイプがあり、オープン型とカバー型である。カバー付きホッパ車は、穀物、砂糖、肥料などの要素︵主に雨︶から保護する必要がある貨物に使用される。オープン車は石炭などの商品の輸送に使用され、濡れや乾によるで影響が少ない商品を対象とする。ホッパ車は、貨物処理の自動化が求められるたびに、世界中の鉄道で使用されてきた。
コンテナ化[編集]


詳細は「コンテナリゼーション」を参照
コンテナ化とは、貨物を積み込んで密封し、コンテナ船、鉄道車両、トラックに載せることができる標準的な海上コンテナ(ISOコンテナ) を使用したインターモーダル輸送システムである。コンテナ化は貨物輸送に革命をもたらした。2009年の時点で、世界中の非バルク貨物の約90%は、コンテナ船によって輸送されている[9]。全コンテナ積み替えの26%は中国で行われている[10]。2005年の時点で、合計約 1,800 万個のコンテナが年間2億回以上輸送されている。
世界中で同じサイズのコンテナを使用することで、異なる軌間における列車間積み替えが容易になり、国ごとに互換性のない鉄道軌間によって引き起こされる問題が軽減された[11]。
二段積み[編集]
詳細は「複層貨物鉄道輸送」を参照
ピギーバック輸送[編集]
詳細は「ピギーバック輸送」を参照
特殊貨物[編集]

いくつかの種類の貨物は、コンテナ化やばら積みに適していないため、これらは貨物に合わせて特別に設計された特別な車で輸送される。
各国の状況[編集]
| 国 | 貨物輸送量 (百万トンキロ) |
|---|---|
| ロシア連邦 | 2544828 |
| 米国 | 2102084 |
| インド | 707665 |
| オーストラリア | 447435 |
| カナダ | 444032 |
| カザフスタン | 302156 |
| ウクライナ | 175587 |
| ドイツ | 108406 |
| メキシコ | 86224 |
| ポーランド | 51096 |
| ベラルーシ | 42420 |
| イラン | 35963 |
| フランス | 31282 |
| ウズベキスタン | 23632 |
| スウェーデン | 22094 |
| イタリア | 20750 |
| オーストリア | 20498 |
| モンゴル | 18972 |
| 日本 | 18340 |
| リトアニア | 15865 |
| トルコ | 15428 |
| チェコ | 15251 |
| イギリス | 15212 |
世界の鉄道貨物輸送量については「国の鉄道利用順リスト#貨物鉄道」を参照
各国の貨物輸送に占める鉄道シェア:
- 日本: 4.9%(2019年; トンキロベース) [13]
- 米国: 27.9%(2019年; トンキロベース)[14]
- EU28 : すべての内陸交通の 20%未満(2014年)[15]
- 中国: 8%(2016年)[17]
- ロシア: 約12%(2016年)[18]
- オーストラリア:57%(2021年; トンキロベース)[19]。
米国[編集]
「アメリカ合衆国の鉄道」も参照
米国において鉄道は、旅客運送よりも貨物運送が主力であり、業界団体としてアメリカ鉄道協会︵AAR︶が存在する。貨物鉄道網は総延長 140,000 マイルに及ぶ[20]。貨物の52%はばら積み貨物、48%はインターモーダル輸送である[14]。
鉄道輸送は長距離輸送において約40%を占める最大シェアを持つ︵トンマイル換算︶[20]。団体交渉に参加する鉄道労働者の平均報酬は、全産業の上位10%以内に入るという[20]。AARによれば、鉄道によってインターモーダル輸送される貨物は、アメリカ人1人あたりに換算すると年間約61トンになるという[21]。事業者は複層貨物鉄道輸送への投資を重ねてきた[21]。
-
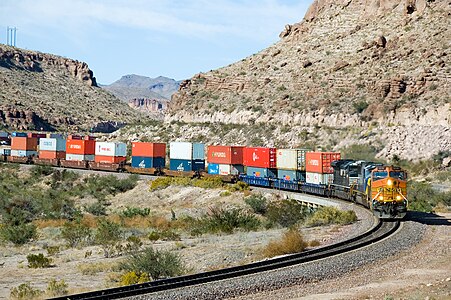 アリゾナ州の列車。20フィート、40フィート、53フィートのコンテナを二重に積み上げた状態
 -
![米国国内規格であるUMAXコンテナ(英語版)。ユニオン・パシフィック鉄道とCSXトランスポーテーションのアライアンスであり、コンテナ全長は53ftに及ぶ(ISO規格外)[22]。](//upload.wikimedia.org/wikipedia/commons/thumb/6/66/Benching_Freight_Train_Graffiti_in_SoCal_%28June_11th_2021%29_%2851256160058%29.jpg/450px-Benching_Freight_Train_Graffiti_in_SoCal_%28June_11th_2021%29_%2851256160058%29.jpg)

![米国国内規格であるUMAXコンテナ(英語版)。ユニオン・パシフィック鉄道とCSXトランスポーテーションのアライアンスであり、コンテナ全長は53ftに及ぶ(ISO規格外)[22]。](http://ja.wikipedia.org/wiki/%E3%83%95%E3%82%A1%E3%82%A4%E3%83%AB:Benching_Freight_Train_Graffiti_in_SoCal_%28June_11th_2021%29_%2851256160058%29.jpg)
欧州[編集]
英国の貨物鉄道会社は Direct Rail Services、Freightliner Group、DB Cargo UK、GB Railfreightの4社が主要事業者である。ほかに小規模事業者として Colas Rail、DCRail、Mendip Rail、Rail Delivery Groupが存在する[23]。2017年までに、英国に入国するコンテナの4個に1個は鉄道で輸送されている[24]。
ドイツにおいて鉄道貨物輸送は、貨物輸送全体の18.5%を占め1,292億トンキロ(2019年)となり、輸送システムの中では道路輸送に次いで2番目のシェアを持つ[25]。
-
 欧州圏にける鉄道貨物輸送シェア(2017年)
 -
 英国の国内貨物輸送シェア(トンキロ)
 -
 ドイツの貨物輸送(トンキロ)。赤は道路、緑は鉄道、青は水運


日本[編集]
| 事業者 | コンテナ輸送 | 車扱輸送 | 合計 |
|---|---|---|---|
| 名古屋鉄道 | 0 | 1,280 | 1,280 |
| 大井川鐵道 | 0 | 28,518 | 28,518 |
| 秋田臨海鉄道 | 250,965 | 0 | 250,965 |
| 黒部峡谷鉄道 | 0 | 406,153 | 406,153 |
| 西濃鉄道 | 0 | 706,492 | 706,492 |
| 福島臨海鉄道 | 334,997 | 740,131 | 1,075,128 |
| 八戸臨海鉄道 | 1,666,981 | 0 | 1,666,981 |
| 衣浦臨海鉄道 | 130,040 | 1,793,047 | 1,923,087 |
| 鹿島臨海鉄道 | 2,770,307 | 0 | 2,770,307 |
| 仙台臨海鉄道 | 1,199,269 | 2,862,789 | 4,062,058 |
| 水島臨海鉄道 | 4,175,834 | 0 | 4,175,834 |
| 神奈川臨海鉄道 | 939,495 | 5,196,528 | 6,136,023 |
| 名古屋臨海鉄道 | 6,687,000 | 6,512,000 | 13,199,000 |
| 京葉臨海鉄道 | 4,069,996 | 16,273,788 | 20,343,784 |
| 三岐鉄道 | 0 | 23,766,065 | 23,766,065 |
| 岩手開発鉄道 | 0 | 24,499,278 | 24,499,278 |
| 秩父鉄道 | 0 | 67,221,201 | 67,221,201 |
| 民鉄・公営合計 | 22,224,884 | 150,007,271 | 172,232,155 |
| 日本貨物鉄道 | 16,815,660,182 | 1,229,238,455 | 18,044,898,637 |
日本では、貨物鉄道事業者は22社が存在する[27]。
●日本貨物鉄道︵JR貨物︶ - 日本最大の事業者。
●臨海鉄道︵10社︶- 第三セクター方式で運営される。
●その他民鉄︵11社︶
現在では、コンテナ輸送と車扱輸送に大別される[28]。
設定されている列車については「貨物列車#日本の貨物列車」を参照
貨物輸送キロの推移については「日本の鉄道#統計」を参照
営業区間[編集]
日本ではJR貨物がJR旅客鉄道各社、および整備新幹線開業による並行在来線を転換した第三セクター鉄道会社の保有する線路︵路線︶の多くを借受ける形で第二種鉄道事業者として営業している。また一部区間での特殊な事例として、JR貨物が輸送する路線と接続するごく少数の私鉄︵秩父鉄道、三岐鉄道、西濃鉄道のほか、工場地帯の臨海鉄道各社など︶や大井川鐵道井川線、化学工場・製紙工場などに引き込まれている専用鉄道が、末端部の輸送を受け持っている。なお、奈良県・和歌山県・島根県・徳島県・高知県・長崎県・沖縄県の7県に貨物列車は走っていない。
かつて鉄道は旅客と貨物をともに営業し、駅の貨物扱いも通常業務であった。中小私鉄はもとより、大手私鉄でも狭軌線で、明治・大正時代に未電化︵蒸気機関車︶で開業した歴史を有す東武鉄道、西武鉄道、名古屋鉄道、南海電気鉄道などの会社は、旅客列車の合間に貨物列車を多く運行した。戦後はモータリゼーションの進展に伴うトラック輸送の普及、前述の1984年の貨物列車の方式変更および中小私鉄の路線自体の廃止によって多くの会社で貨物列車が廃止・縮小された。大手私鉄で最後まで貨物営業した東武も2003年に貨物列車が全廃され、大手私鉄で自社または乗り入れ先事業者関連の車両輸送を除いて貨物列車を運行している会社は存在しない。

隅田川駅 小口貨物ホーム︵1966年︶
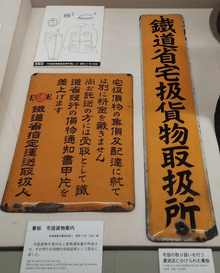
日本通運 鉄道省指定運送取扱人看板︵1935︶
かつての国鉄においては、貨物輸送は以下に分類されていた[29]。
●荷物扱い - 旅客列車で運ばれる[30]。
●鉄道手小荷物[31] - 手荷物は俗にチッキと呼ばれる[30]。
●貨物扱い[注釈 1][33]
●貸切扱い︵車扱貨物︶[34][30]
●コンテナ扱[30] - 1959年にサービス開始[35]。
●小口扱︵さらに以下に区分される︶[30]
●瓲扱い︵ぐらむとんあつかい︶[34] - 貨物は発駅で受託されて、鉄道の負担で積み卸しおよび運搬を行われ、着駅で荷受け人に引き渡されるのみであった。運賃は瓲単位であることからの名称である。運賃は小口扱いよりは安いため、小口扱いには大きくて、貸切扱いには小さい貨物︵2トン〜5トン、ほど︶の託送に適していた。ただし一部の貨物は瓲扱いは適用されなかった[36]。
●小口扱い︵こぐちあつかい︶[34] - 運賃は 10 kg 単位で、少量の貨物に適していた。発駅で受託されて貨物列車で運送され、着駅で引き渡されるのが原則であるが、6 km以内の地域に限って荷主の請求によって一定の料金で集貨および配達が行われ、駅留で受託されたものであっても荷受け人の請求で有料で配達される。ただしこの扱いは小口扱いに対して貨物等級の定めがない貨物、危険品、火薬類の一部の物には適用されない[36]。運賃に集配料金が含まれていないから特別小口扱いよりも安いが、積み卸し作業の料金は含まれ、また少量単位であるから貸切扱いよりは高くなる。
●宅扱い︵たくあつかい︶ - かつては特別小口扱いと称した。小口扱い、瓲扱い、貸切扱いに対して、贈答品などの少量の貨物に適した扱いで、荷送り人の宅から発駅までの集貨および着駅から荷受け人の宅までの配達が、別料金を取られずに、かつ迅速に行われた。ただし集貨および配達のいずれも、駅から約 6 km 以内の地域内であった。またこの扱いの貨物は輸送列車が定められて特に急送されるので、急ぎの品物、腐敗しやすい物などに便利であった。
●特別小口扱い︵とくべつこぐちあつかい︶[34] - 少量貨物の無料集配付速達の扱いである。発駅から6 km以内︵鉄道所定の集配区域内︶であれば一定の大きさの制限以内の物に限って無料で集貨される。電話、はがき、伝言などで貨物の品名、概算数量、行先などを述べ、発駅および鉄道指定の運送店に申し込む。運送は毎日、一定の列車で行われ、駅渡希望のものまたは貨物引換証などを要するものの他は、着駅から6 km以内の届け先まで無料で配達される。少量の急を要する貨物に適し、運送状を作成する必要がないから便利であった。ただし、小口扱いの等級のない貨物[37]、危険品、汚穢品または1個の長さ4.5 m、重量200 kg、容積1立方メートルを超えるもの、運賃が無賃となるもの、2割を越えて運賃を低減するものなどに対してはこの扱いは行われない。運賃は等級によらず、距離と重量とのみによって1口ごとに計算されるが、特別の貨物は最小5割、最大20割の割り増しが付加される。すなわち運賃は、鉄道、航空、自動車それぞれ別に計算し、発着区間を合算するのが本則であるが、宅扱いのみは鉄道省営の航路、自動車線の粁程はもちろん、内地の連帯鉄道線にまたがる場合でも通算される。その賃率には普通賃率と特別賃率とがあって、生活必需品には特別賃率が適用され、﹁嵩高﹂な軽量品には5割増し、10割増し、20割増しがあった。運賃の支払いは着払いにすることができた。運賃には集配料金が含まれ、貨物の取扱いのなかで最も高くなる。特別小口扱いは昭和10年10月1日、一般的貨物運賃の改正にあたって制度ならびに内容が変更され、運賃が引き下げられるとともに﹁宅扱い﹂と改称された。
●小口混載扱︵通運業者による鉄道利用運送事業︶[30]
1974年︵昭和49年︶からは、小口扱貨物について普通扱小荷物に吸収する﹁荷貨一元化﹂が行われ、小量物品輸送が一本化された[38]。1986年︵昭和61年︶には、小量物品輸送サービスも終了となった。
国鉄における歴史[編集]

-
![国鉄の貨物運送状。荷主の運送契約の申込みの証拠となる。[33]](//upload.wikimedia.org/wikipedia/commons/thumb/4/4a/JNR_Bill_of_Lading.webp/467px-JNR_Bill_of_Lading.webp.png) 国鉄の貨物運送状。荷主の運送契約の申込みの証拠となる。[33]
国鉄の貨物運送状。荷主の運送契約の申込みの証拠となる。[33] -
![国鉄の貨物引換証。貨物の引渡し時に要する有価証券である。[33]](//upload.wikimedia.org/wikipedia/commons/thumb/e/ee/JNR_Waybill.webp/392px-JNR_Waybill.webp.png)
![国鉄の貨物運送状。荷主の運送契約の申込みの証拠となる。[33]](https://akarinohon.com/text/taketori.cgi/ja.wikipedia.org/wiki/%25E3%2583%2595%25E3%2582%25A1%25E3%2582%25A4%25E3%2583%25AB:JNR_Bill_of_Lading.webp)
![国鉄の貨物引換証。貨物の引渡し時に要する有価証券である。[33]](https://akarinohon.com/text/taketori.cgi/ja.wikipedia.org/wiki/%25E3%2583%2595%25E3%2582%25A1%25E3%2582%25A4%25E3%2583%25AB:JNR_Waybill.webp)
日本における課題[編集]
交通渋滞の悪化に繋がり環境負荷も高いが柔軟な輸送対応が可能で多くの場合において速達性に優れるトラック輸送、速達性は低いが大量輸送とコストに優れ環境負荷も低い内航貨物船、とはっきりした利点と欠点があり棲み分けが行われている両者に比べると、その両者の中間に位置する鉄道貨物には制限が多い。
●東海道本線・山陽本線など貨物需要の多い路線では旅客列車の需要も大きく路線が混雑していることに加え、昭和59年以降の合理化で貨物輸送用の側線などの地上設備を撤去した駅も少なくないため貨物列車の増発には更なる設備投資が必要になる。しかも、設備の多くは旅客鉄道会社が保有していることが多く、アボイダブルコスト︵回避可能経費︶の問題から多くの旅客鉄道会社は設備投資に慎重になっている。
●鉄道は迂回運転が困難なことから道路輸送に比べ天候や自然災害の影響を受けやすい︵冬季の北海道など例外もある︶。また自然災害が原因で路線が運休になった場合に輸送自体がストップする。トラック輸送は豊富な道路上の迂回ルートが利用でき、内航路貨物船には悪天候による一時的な運休はあっても長期に渡って途絶する心配はない︵津軽海峡など、例外もある︶。
●日本の鉄道貨物のコンテナ貨車は、コキ100系・コキ200形の増備により20フィートのISOコンテナを輸送できるようになったが、コンテナ貨車の車両長が20メートル程度に留まるため、通常のコンテナ貨車︵コキ100系列︶では、1両20メートルの車両長に対し、40フィート︵12.2 m︶海上コンテナを1個しか積めない。また荷重40トンを許容するコキ100系列に搭載する40フィートコンテナの総重量は30トン少々であるため、荷重の面でも無駄が生じる。そして貨物列車全体の牽引トン数の制限とともに列車長の制限もあり、結果として海上コンテナの輸送力はそれほど大きくできない。なお、20フィートISOコンテナ2個分に長さを合わせた貨車︵コキ200形︵全長 15 m︶など︶も存在するが、車体長が短いぶん輸送コンテナ数を稼ごうとすると必然的に増結が必要となり、このことは第一種鉄道事業者へ支払う線路使用料の増大を招き貨物輸送会社の収支を悪化させるもととなる。そして海上コンテナ専用のコキ200形では日本の輸送単位である12フィート・5トン の国内向けコンテナは輸送できず、相互運用で支障をきたす。
●海上輸送用のISOコンテナは40フィート以上の長いコンテナが主流だが、40フィートコンテナに対応した荷役機器を備えた鉄道貨物駅は一部のみである[39]。
●日本では整備新幹線の開業に伴う並行在来線の経営分離により、今後、線路使用料の負担が増えていくことが予想される。
脚注[編集]
注釈[編集]
出典[編集]
(一)^ “Rail Freight Shipping”. 2016年2月20日時点のオリジナルよりアーカイブ。2016年2月閲覧。
(二)^ ab植田義明﹁新しい鉄道貨物営業――その背景と基本的方向﹂﹃国有鉄道﹄41(3)(405)、交通協力会、1983年3月、10-14頁、doi:10.11501/2277123。
(三)^ Armstrong, John H. (1978). The Railroad-What It Is, What It Does. Omaha, Neb.: Simmons-Boardman. pp. 7 ff
(四)^ abcdeHofbauer, Florian; Putz, Lisa-Maria (2020). “External Costs in Inland Waterway Transport: An Analysis of External Cost Categories and Calculation Methods”. Sustainability (MDPI) 12 (5874): 9 (Table 11). doi:10.3390/su12145874 2022年3月29日閲覧。.
(五)^ abGreene, Scott. Comparative Evaluation of Rail and Truck Fuel Efficiency on Competitive Corridors Archived 6 January 2012 at the Wayback Machine. p4 Federal Railroad Administration, 19 November 2009. Accessed: 4 October 2011.
(六)^ Shefer, Jon. “Rail Freight Transportation: How To Save Thousands Of Dollars & The Environment”. 2015年12月8日時点のオリジナルよりアーカイブ。2015年12月閲覧。
(七)^ “世界最大ロボ”実用化に王手 リオ・ティント、無人貨物列車で鉄鉱石輸送﹃日刊工業新聞﹄2018年7月18日︵2018年8月13日閲覧︶。
(八)^ Stopford, Martin (1997). Maritime Economics. London: Routledge. pp. 292–93
(九)^ Ebeling, C. E. (Winter 2009). “Evolution of a Box”. Invention and Technology 23 (4): 8–9. ISSN 8756-7296.
(十)^ “Container port traffic (TEU: 20 foot equivalent units) | Data | Table”. Data.worldbank.org. 2011年11月27日時点のオリジナルよりアーカイブ。2011年11月28日閲覧。
(11)^ See e.g. the description of container transfer process at Alashankou railway station in: Shepard, Wade (2016年1月28日). “Why The China-Europe 'Silk Road' Rail Network Is Growing Fast”. Forbes. 2017年8月27日時点のオリジナルよりアーカイブ。2016年1月閲覧。
(12)^ “Railways, goods transported (million ton-km)”. World Bank. 2023年9月閲覧。
(13)^ ﹃貨物の輸送機関別輸送量・分担率の推移﹄︵レポート︶国土交通省、2019年。
(14)^ ab“Freight Rail Overview”. 連邦鉄道局. 2023年10月閲覧。
(15)^ “File:Modal split of inland freight transport, 2014 (% of total inland tkm) YB17.png - Statistics Explained”. ec.europa.eu. 2017年10月7日時点のオリジナルよりアーカイブ。2018年5月8日閲覧。
(16)^ abc﹃外国輸送機関別輸送量の推移︵貨物 輸送トンキロ︶﹄︵レポート︶国土交通省、2012年。
(17)^ Meng, Meng (2017年9月21日). “China's small factories fear 'rail Armageddon' with orders to ditch...”. オリジナルの2018年1月22日時点におけるアーカイブ。 2018年5月8日閲覧。
(18)^ “Russia's RZD speeds up rail service to attract cargo”. www.joc.com. 2017年10月7日時点のオリジナルよりアーカイブ。2018年5月8日閲覧。
(19)^ Trainline 10 (Report). The Department of Infrastructure, Transport, Regional Development. 2023. Chapter.2. ISBN 978-1-922521-98-9。
(20)^ abc“Freight Rail Facts & Figures”. アメリカ鉄道協会. 2023年9月閲覧。
(21)^ ab“Freight Rail & Intermodal: The Fastest Growing Rail Segment”. アメリカ鉄道協会. 2023年9月閲覧。
(22)^ “EMP and UMAX Container Specifications”. ユニオン・パシフィック鉄道. 2024年2月閲覧。
(23)^ “Rail industry needs clarity on contracts and public support”. The Guardian (2012年10月24日). 2013年5月23日閲覧。
(24)^ “Freight Network Study”. networkrail.co.uk. p. 19 (2017年4月). 2020年10月28日閲覧。
(25)^ Beförderungsmenge und Beförderungsleistung nach Verkehrsträgern (Report). ドイツ国家統計局. 11 November 2020.
(26)^ 鉄道統計年報﹇令和2年度﹈ (Report). 国土交通省. 2020.
(27)^ “貨物鉄道事業者の概況”. 国土交通省. 2023年9月閲覧。
(28)^ “我が国の貨物鉄道輸送>貨物列車の体系”. 国土交通省. 2023年9月閲覧。
(29)^ 岡田清﹁競争的環境下における鉄道貨物輸送の変遷﹂﹃成城大學經濟研究﹄第128巻、1995年、204-187頁、NAID 110000245085。
(30)^ abcdef日本通運﹃流通百科﹄1966年、80-93頁。doi:10.11501/2509776。
(31)^ ﹃日本国有鉄道荷物運賃料金制度の概要とその変遷﹄日本国有鉄道、1960年。doi:10.11501/1700945。
(32)^ 日本国有鉄道 編﹃貨物運送規則同補則﹄中央書院、1952年。doi:10.11501/2465463。
(33)^ abc交友社編集部 編﹃目で見てわかる鉄道常識事典﹄交友社、1966年、38-40頁。doi:10.11501/2509702。
(34)^ abcd貨物運送規則解説 1930, p. 12.
(35)^ 山野邊義﹁鉄道貨物輸送の動向と課題﹂﹃流通問題研究﹄1994年、39-55頁、NAID 110007189995。
(36)^ ab貨物運送規則解説 1930, p. 14.
(37)^ 貨物運送規則解説 1930, p. 13.
(38)^ ﹃昭和48年度 運輸白書﹄運輸省、1972年、第3章経営の現状 第1節 日本国有鉄道。
(39)^ 鉄道局﹃輸出入コンテナ貨物における鉄道輸送促進に関する調査会 報告書﹄︵レポート︶国土交通省、2005年。
参考文献[編集]
- 板井一二『貨物運送規則解説』日本交通学会、1930年。doi:10.11501/1173844。
関連項目[編集]
| 概要 |
|
|
|---|---|---|
| 輸送 |
| |
| 荷役 |
| |
| その他 |
| |

この項目は、鉄道に関連した書きかけの項目です。この項目を加筆・訂正などしてくださる協力者を求めています(P:鉄道/PJ鉄道)。 |