
たばこ

たばこ︵煙草、莨、tobacco︶は、タバコ (Nicotiana tabacum) の葉を加工して作られる製品である。日本の法令では﹁たばこ事業法2条3号﹂より、﹁製造たばこ﹂と定義され、﹁葉たばこを原料の全部又は一部とし、喫煙用、かみ用又はかぎ用に供し得る状態に製造されたもの﹂とされる。

パレンケ遺跡で発見された、喫煙の様子を描いたレリーフ
植物としてのタバコは、原産地のアンデス山脈地方から伝播して南北アメリカ大陸全域において使用されるようになった。7世紀ごろのマヤ文明・パレンケ遺跡においては発見された神がタバコを吸うレリーフは、同時期に既に喫煙の習慣がはじまっていたことを示している[1]。たばこは嗜好品として使用されるほか、薬用や宗教行事においても多用されていた[2]。
歴史[編集]
喫煙のはじまり[編集]

タバコの伝播[編集]
1492年、クリストファー・コロンブスがアメリカ大陸を確認してしばらくすると、新大陸中に普及していたたばこは新たにやってきたヨーロッパ人たちの目に留まるようになった。新大陸からたばこはヨーロッパへと伝播し、1571年にはスペインの医師であるニコラス・モナルデスが新大陸の薬用植物誌を書いた中でたばこの使用法や薬効を詳述している[3][4]。 アジアへの伝播はスペイン人によって1575年にフィリピンに持ち込まれたものが最初であり、以後17世紀初頭までのわずかな間に福建省、インド、ジャワ、日本などにたばこが広まっていった。ほぼ同じ時期に、中東のサファヴィー朝やオスマン帝国にもたばこが広められている。1630年までには西アフリカに、1638年にはマダガスカルでもたばこが確認され、こうしてたばこは新大陸発見からわずか130年ほど、本格的に普及のはじまった1570年代からは60年ほどで全世界へと普及した[5]。この伝播の過程においては、アフリカを除く伝播したほとんどの文化圏︵ヨーロッパ諸国、アジア、中東等︶においてたばこの薬効に触れた文献が存在しており、薬として受容された面が大きいと考えられている[6]。ただしいったん受容されると、どの文化圏においてもたばこはすぐに嗜好品としての地位を確立するようになった。 急速に全世界へと広まったことでたばこは重要な換金作物となり、世界各地で生産が行われるようになったが、なかでもたばこ生産が経済の重要な地位を占めるようになっていたのはイギリスの植民地であったチェサピーク湾地方にあるヴァージニアとメリーランドの植民地だった。ここで生産された葉たばこはイギリスに輸入されたのちヨーロッパ大陸へと再輸出され、イギリス・西インド諸島・北アメリカ植民地を結ぶ三角貿易の重要な一角となっていた[7]。このたばこ生産は北アメリカ植民地に独自の経済的基盤を与えることとなった。 1970年代ごろからたばこの有害性を主張する禁煙運動が盛んとなり、先進国を中心にたばこの消費は減少の一途をたどることとなった。多国籍企業による豊富な資金力は、開発途上国においてたばこの消費を増加させたため、2005年には世界保健機関 (WHO) が主導するたばこの規制に関する世界保健機関枠組条約︵たばこ規制枠組条約︶が結ばれた[8]。喫煙法の歴史的変化[編集]
古代南北アメリカにおけるたばこの使用法としては、すでに噛みたばこ、嗅ぎたばこ、喫煙の3種のすべてが出そろっており、また喫煙においてもそのまま乾燥させた葉を巻いて吸う︵葉巻︶、トウモロコシの葉などに刻んだ煙草を巻き込む︵紙巻きたばこ︶、刻んだ葉を喫煙具に入れて吸う︵パイプや煙管︶といった現代において使用される喫煙方法が出現していた[9]。 新しくたばこが伝播した国々の喫煙方法はさまざまな形態を取った。もっとも一般的だったものは喫煙具に刻みたばこを詰めて喫煙するパイプたばこであり、スペインを除く各国はまず最初にこの方式でたばこを消費し始めた。日本もこの方式であり、喫煙のための煙管が広く普及した。これに対し、新大陸の広大な領土を持ちインディオたちとの接触も密であったスペインでは、まず葉巻と嗅ぎタバコという二つの方法が主流となった。このうち嗅ぎタバコはフランスを皮切りにヨーロッパへと普及していき、18世紀後半にはヨーロッパにおいてはパイプをしのぐ人気を持つようになった[10]。アジアでは全く新しい喫煙方法として、おそらく16世紀のペルシアにおいて水タバコが発明され[11]、17世紀中にはインドや中近東、東アフリカといった地域においてこれが主流の喫煙方法となった。 ヨーロッパ大陸においては19世紀中ごろから、嗅ぎタバコからパイプたばこへとふたたび喫煙方法の転換が起こった[12]。ただしこの転換は緩やかなもので、20世紀に入ってもしばらくの間は嗅ぎタバコの消費は一定の割合を占めており、またスウェーデンのように第二次世界大戦に入るまで嗅ぎタバコが主流となっていた国家も存在した[13]。また18世紀末から、それまでほぼスペインのみで消費されていた葉巻が徐々にヨーロッパ大陸に広まるようになり[14]、19世紀には流行を見せた。アメリカにおいては、アメリカ独立戦争のころからプラグタバコなどの噛みたばこが流行を見せるようになり、19世紀のほぼ全期間にわたってアメリカで最も利用される喫煙方法となっていた。この噛みたばこの隆盛はヨーロッパ大陸ではあまり見られず、アメリカの喫煙を特徴づけるものとなっていた[15]。20世紀に入ると紙巻きたばこが全世界において急速に普及し[16]、パイプたばこのみならずそれまで嗅ぎタバコが主流だったスウェーデンや噛みたばこが主流だったアメリカにおいてもたばこ消費の主流を占めるに至った。有害性[編集]
世界保健機関 (WHO)元事務局長のグロ・ハーレム・ブルントランドが﹁たばこは最大の殺人者である﹂[8] と述べているように、20世紀になってからたばこの有害性が度々指摘されている。主な害として、中毒性、発がん性、心臓病のリスク向上などが挙げられている。また、たばこの流煙には、一酸化炭素 (CO)、ニコチン、タール、シアン化物など、多くの有害物質が含まれており、非喫煙者と比べ、がんや心臓病などの生活習慣病を発病しやすくなる。
薬物に関する独立科学評議会における、ニコチン含有製品を多基準意思決定分析によって数値化した研究では、紙巻きたばこの有害性を100とすると、小型葉巻67、パイプ22、水パイプ14、ニコチンガムやパッチは約2である[17]。
たばこ産業は喫煙者を安心させるために﹁低タール﹂の紙巻たばこを開発し、1980年代に入るとさらに﹁ウルトラライト﹂などの商品を販売促進してきた[18] が、近年ではむしろ肺がん死亡率が上昇してきているという疫学研究の結果が得られており[19]、こうしたタバコが原因のひとつであるとして説明されている[20]。古い時代と比較して、女性も男性のように早い年齢で頻繁に吸うようになったことも、女性の死亡リスクを増加させてきた[21]。
2015年12月16日のイギリスの議会庶民院では、英国公衆衛生庁が﹁電子たばこが紙巻たばこの喫煙よりも95%安全である﹂と広報しており、デーヴィッド・キャメロン首相︵当時︶は、﹁国民の健康を改善するための正当な方法であることをはっきりと説明すべきである﹂と答弁した[22]。
死亡者で比較すれば、2009年アメリカ合衆国では、たばこに起因する443,000人の死亡が確認された一方で、アルコールでは98,334人であり、他の薬物では37,485人であった。2008年に処方薬の過剰摂取による死亡が20,044人、違法薬物の使用に起因する死亡は16,044人である[23]。

フィリピンにおける紙巻たばこの外装の箱の画像付き警告。たばこの規 制に関する世界保健機関枠組条約︵たばこ規制枠組条約︶の第11条では、警告表示は、望ましくは包装の面積の50%以上を用い、画像を使用してもよいとしている。
たばこの有害性は古くから指摘されており、そのため多数の国・地域においてたばこの購入及び消費には年齢制限がかけられている。
日本においては1900年︵明治33年︶の第2次山縣内閣︵山縣有朋首相︶下に未成年者喫煙禁止法︵現・二十歳未満ノ者ノ喫煙ノ禁止ニ関スル法律︶が制定されて、﹁満20歳未満の者は喫煙をすることができない﹂と定められている。一般に﹁成年になるまで喫煙をできない﹂と解釈されてきたが、日本における﹁喫煙の年齢制限﹂は同法において明示されているため、﹁民法上の成年﹂とは独立した根拠に基づいている。
ただし、成年になるまで喫煙をできないと解釈されてきたため、2015年︵平成27年︶に第3次安倍内閣︵安倍晋三首相︶下で公布・2016年︵平成28年︶施行の公職選挙法改正により﹁選挙権が20歳から18歳に引き下げられる﹂とともに﹁飲酒・喫煙年齢を18歳に引き下げること﹂も議論されるようになり、同年自由民主党の特命委員会は﹁喫煙年齢を18歳に引き下げる﹂よう政府に求める方針を示した。ただし禁煙運動が進む中、この引き下げには慎重論も根強く残っている[24]。
年齢制限は各国で古くからおこなわれてきたが、1970年代後半よりたばこの害は深刻に受け止められるようになり、禁煙運動が大きな広がりを見せるようになった。こうした中で各国はたばこに対し厳しい規制を敷くようになり、1988年には国際連合によって毎年5月31日が世界禁煙デーと定められた。たばこ広告は19世紀以降たばこの消費拡大に大きな役割を果たしてきたが、各国において禁止されるようになり、たばこのパッケージには健康に対する警告が印刷されるようになった。
2005年のたばこの規制に関する世界保健機関枠組条約︵たばこ規制枠組条約︶は、﹁受動喫煙の防止、商品のイメージを想起させない統一的な外装、警告表示の掲載、またそれを画像付きにすることといったガイドライン﹂を提示してきた。
規制[編集]

種類[編集]
「喫煙」も参照
たばこは燃やしてその煙を吸う︵喫煙︶ものと、そうしないものの二つに区別される[25]。一般的には煙草のほとんどは喫煙するタイプのものであるが、喫煙しないタバコとしては、後述する噛みタバコと嗅ぎタバコの二つの種類が存在する。喫煙タバコはさらに、﹁葉巻きたばこ﹂と﹁刻みたばこ﹂の2種に大別される。葉巻きたばこはタバコの葉を刻まずに丸めたもので、刻みたばこをタバコの葉で巻いたものも存在する。刻みたばこはその形態によって、さらにいくつかに分類される。このほか、21世紀に入ってから電子たばこ、加熱式たばこが実用化され、広まりつつある。
葉巻きたばこ[編集]
詳細は「葉巻きたばこ」を参照

タバコの葉を筒状に巻いたものであり、シガーとも呼ばれる。葉巻きたばこはもっとも原始的なたばこの形態であり、乾燥し発酵させたタバコの葉を巻いて作られている。発祥はメソ・アメリカ文明からと言われ、元々は先住民族間の交流︵回し呑み︶や、土地の精霊への祖霊祭などに用いられたものを、16世紀からの大航海時代において大陸上陸した貿易商人により古くから貿易品として利用されてきた。
種類は大きく分けて、湿度管理の必要なプレミアムシガーと管理の必要のないドライシガーがある。フィラーは一枚葉を束ねたものを使用する﹁ロングフィラー﹂が主流だが、最近は刻みたばこ状にした﹁ショートフィラー﹂も出回っている。

刻みたばこ
タバコの葉を刻んだもの。刻みたばこは紙で巻いたり、パイプや煙管といった器具に詰めて使用する。刻みたばこを紙にまいて商品化したものが紙巻きたばこである。
刻みたばこ[編集]

紙巻きたばこ[編集]
詳細は「紙巻きたばこ」を参照

一般にたばこという場合これを指す。シガレットとも呼ばれる。パイプ等の喫煙用具を必要とせず着火すればそのまま吸えるので、喫煙者に広く普及している。手軽な反面、必ずフィルター部分を中心に一定量の廃棄部分が発生するためポイ捨てされることも多い。1本あたりの平均的な燃焼時間は3~5分程度で、概ね半分から2/3程度吸ったら火を消して、吸殻として捨てる。火のついた先端は非常に高温で800度近くにもなるので、扱いには注意を要する。紙巻き煙草の税率が高いEUでは、あらかじめ長い煙草を作り、自分で切ってさや紙に詰める製品もある︵ドイツのStax Trio Zigaretten 等︶。
手巻きたばこ[編集]
喫煙者自ら、紙と刻みたばこを別々に用意し、自分で巻いて作る紙巻きたばこを指す。シャグと呼ばれる手巻き用の刻みたばこ、巻紙、フィルターを個別に揃える必要がある。欧州などにおいては既製品の紙巻きたばこは税率が高く設定されているため、喫煙者はより税率の低いシャグを購入し自ら手巻きたばこを作成して喫煙する人も多い。 日本においては、たばこ税はたばこ葉の重量に対し一律に定められているため、既成の紙巻たばこでも手巻き用のシャグたばこでも税率は変わらない(個人輸入する場合も同じ税率になるよう定められている[26])。よって、手巻きたばこに切り替えたとしても必ずしもたばこ代の節約になる訳ではない。詳細は「たばこ税」を参照
ただし、シャグ・巻紙・フィルターの組み合わせを試したり、シャグを加湿して風味の違いを楽しんだり、入れる刻みたばこの量を減らして節約したりと手巻きたばこならではの利点もある。
加熱式たばこ[編集]
詳細は「加熱式たばこ」を参照
たばこ葉を燃焼させない程度の低い温度で加熱し、成分を気化させたものを吸入する。電子たばこと同様に有害性は相対的に低いと評価されている。タバコ葉からニコチンが摂取できるため、たばこ税の課税対象となる。
噛みたばこ[編集]
詳細は「噛みたばこ」を参照
噛みたばこは直接タバコの葉を含む混合物を噛むことにより風味を楽しむものであり、タバコの楽しみ方としては最も古い方法である。北米大陸のインディアンは、ライム︵石灰︶とともに用いている。火気厳禁である場所、たとえば船倉、鉱山、森林などで用いられた。
タバコの葉と石灰などを共に口に含み使用し、唾液は飲み込まず排出する。西部劇などで見られる痰壷はこれを吐き出すためのものである。唾液を飲み込むとニコチン中毒を起こす危険性があり、唾液中のニコチンは水に溶けた状態なので吸収が早く中毒症状も重い。また、口の粘膜から直接成分を吸収する結果、口腔がん及び咽頭がんの大きな要因になるとして問題視されつつある。
現在ではタバコの葉と石灰の組み合わせのほかにさまざまなハーブなどを組み合わせたものや、子供向けの甘味料と香料を多く含んだグトゥカー、ハーブだけで構成されたパーン︵Paan︶と呼ばれる製品もある。インドや東南アジアなどが主要な産地である。
かつては世界的に噛みたばこの使用は一般的であったが、公共の場でつばを吐くという行為が不衛生であり、マナーの観点からも好ましくないことで、徐々に紙巻きたばこに需要が移った。また、昨今の禁煙の風潮と相まって、需要は減少傾向にある。
煙を吸引することによる肺活量の低下がないことで、米国メジャー・リーグの選手に噛みたばこを愛用する者が多く、試合中グラウンドやベンチ内でヤニを吐く光景がよく見られる。米国がん協会の1998年と2003年の調査によれば、36%の大リーガーが噛みたばこを愛用している。しかし、健康面での問題がクローズアップされるにつれ、大リーグでの噛みたばこ使用に厳しい目線が向けられるようになり、現在はマイナーリーグで徹底した禁煙教育が行われるようになっている[27]。一方、大リーグでは禁止に至っておらず、2010年には米下院の公聴会で大リーグでの使用禁止の是非が議論された。殿堂入り選手のトニー・グウィンは、2010年に唾液腺ガンが判明した際に、現役時代に愛用していた噛みたばこが原因ではないかと語った[28]。また、ボストン・レッドソックスの主力投手であったカート・シリングは2014年8月に口腔がんに罹患していることを告白し、30年間にわたり愛好した噛みたばこが原因であると語った[29]。日本のプロ野球においてもアメリカ出身の選手に愛用者が多かったが、今ではほとんど見られなくなった。
日本では﹁煙も出ない、人に迷惑をかけることがないたばこ﹂であるとして普及の動きがあったが、日本人の舌に合わないせいもあって定着しなかった。2000年代にはガムタイプのファイアーブレイクが発売されたが、2009年に製造が終了した。
嗅ぎたばこ(スナッフ)[編集]
詳細は「嗅ぎたばこ」を参照


嗅ぎたばことは、着火せずに香りを楽しむたばこである。タバコの粉末を鼻孔の粘膜などから摂取する。嗅ぎたばこおよびそれを摂取する行為は﹁スナッフ﹂と呼ばれる。口腔がんのリスクを高める。煙を嗜む喫煙よりもその歴史は古いが、日本においてはあまり普及していない。
基本的に、5グラム- 10グラム程度のケースなどに入れられて販売されており、細かな粉末を鼻から吸引する。親指と人差し指で粉末をつまみ吸引する他、手の甲の親指、人差し指の付け根のくぼみに適量︵一つまみほど︶のスナッフを載せ、鼻から吸引するのが一般的な嗅ぎたばこの摂取法である。この三角形の窪みは解剖学の分野で﹁解剖学的嗅ぎタバコ入れ﹂と呼ばれている。
タバコの粉末の入った小袋を歯茎と上唇の間に挟み、歯茎からニコチンを吸収する喫煙︵摂取︶は﹁スヌース﹂と呼ばれる。小袋に入った状態で販売されているのが一般的だが、粉を直接歯茎と唇の間に挟む摂取法もある。いずれにせよ喫煙とは異なり手、鼻、頬などにタバコの粉末が残りやすいことに加え、﹁粉末を鼻から吸引する﹂という行為は麻薬の摂取方法としてもよく知られているために大きな誤解を受けやすい行為であるので注意が必要である。ドラマなどで、嗅ぎたばこの吸引がミステリアスさを醸し出すスパイスとして用いられることがある。
JTのゼロスタイル・ミントは、嗅ぎたばこに馴染みのない日本人に向けた商品で、口から吸い込んで、通る空気を吸い込む。上記の欠点は改善されている。
煙草のケース同様、嗅ぎたばこの粉末ケース︵鼻煙壷︶にも装飾が施されたものがあり、コレクションの対象となっている。ディクスン・カーの代表作の一つに﹁皇帝のかぎ煙草入れ︵The Emperor's Snuff-Box︶﹂というミステリー小説がある。
大きく下記の6種類に分類される。
スコットランド嗅ぎたばこ (Scotch snuff)
イギリス、スコットランドの嗅ぎたばこ、乾燥させてすりつぶしたタバコの粉末に香りをつけたもの。少量を鼻に吸引させ、鼻をつまみ鼻粘膜にすりこんで楽しむ。
アメリカ嗅ぎたばこ (American snuff)
甘い味付けと辛い味付けの2者が主流で、香りや味は様々。湿った粉末様、若しくは細粒様︵ロングカット︶の物を歯茎に塗って楽しむ。また、次の北欧嗅ぎたばこと同じく上歯茎と上唇の間に置いて楽しむ。
北欧嗅ぎたばこ︵スヌース︶(snus)
主に北欧のスウェーデンで生産されている。ルーズ︵粉末︶タイプとポーション︵小袋入り︶タイプの2種類がある。ルーズタイプは湿っており、指で口紅や玉のような形状にするか、ポーショナーと呼ばれる道具を使って上歯茎と上唇の間に置く。ポーションタイプは乾燥させたスヌースが入っている物と、少し湿らせたのが入っている物がある。使用法はルーズタイプと同じ。
中国嗅ぎたばこ︵鼻烟︶
粉末状のたばこを指につけたり手の甲にのせ、鼻から吸引して楽しむ。薬としての効能を謳う銘柄もある。明末期~清初期にキリスト教とともに中国にもたらされたが、献上品のスナッフボックスは湿度に弱く数も少なかったため、湿度の高い中国の気候に合わせた独自の鼻烟壺が開発され清代に広く普及した。鼻烟壺は持ち歩くことを前提とした携帯用の数センチ大のものと、自宅に置く親器に相当する10センチ以上の大きさのものがあるが、特に携帯用のものは象牙、宝石、陶磁器など様々な素材をもとに工芸的な粋が凝らされ、手中で常に愛玩される工芸品となった︵この点では日本の印籠や根付に相当する︶。モンゴルやチベット周辺地域に愛好者が多かったが、現在の中華人民共和国では鼻烟を嗜む人はかなり少数になってしまっている[30]。
ゼロスタイル・ミント (zero style mint)
タバコ葉が入ったカートリッジをパイプにセットして口から吸引する。JT独自の商品。
ニコチンフリー嗅ぎたばこ (nicotine free snuff or snus)
タバコ葉を使用していない。ハッカやミントの粉末が主成分。使用法は上記のスコットランド嗅ぎたばこや北欧嗅ぎたばこと同じ。

イタリア・サビネリ社製のパイプ
喫煙具[編集]
パイプ[編集]

詳細は「パイプ (たばこ)」を参照
ブライヤ、トウモロコシの軸、セピオライト︵海泡石=メシャム︶などを加工したものに樹脂製の吸い口を取り付け作られる。主にアメリカやヨーロッパ等で使われる喫煙具。香料を加えて作られた専用の刻みたばこ︵香料不使用のものもあり︶をボウルに詰めて着火し吸う。欧州では19世紀ごろまでは、労働者等の大衆の喫煙方法とされていた。紙巻きに比べタバコを味わうのに向いている。火が消えやすく、快適に喫煙するにはタバコ葉の詰め方も含めて技術を要する。葉の分量はおおむね2~3グラム︵紙巻きたばこ2~4本程度︶。吸った煙は肺に入れず、ふかすようにして口腔粘膜からニコチンを摂取する。時間当たりのタバコ葉消費量︵燃焼量︶は紙巻きの数分の一になるが、フィルターを使わないことが多く、そのぶん濃くなるので紙巻よりも弱くゆっくり吸うためである。パイプを1時間程度かけて一服することにより、紙巻きたばこ10本程度をチェーンスモーキングする程の充足感が得られるとも言われる。場合によっては非常に経済的な喫煙方法であるが、喫煙具自体が高価なことが多く、数千円から手作りのものは数十万円するものもある。各種のデザインのものが売られておりコレクションをする人も多く、趣味性の高い喫煙方法と言える。
水たばこ[編集]

詳細は「水タバコ」を参照
水パイプ、水キセル、シーシャとも呼ばれ、タバコ煙を水にくぐらせた後、極めて長い煙路を経て吸引する。タール分や一酸化炭素を主に、多くの煙に含まれる成分が水に溶けて省かれ、また煙温も低下するので、煙および︵不可視な︶燃焼ガスに一定の成分変化があるとされている。トルコなどの中東方面で用いられる大型のものから、中国などアジアで見られる小型のものまでさまざまあり、日本でも吹きガラス製の水パイプなどが存在している。この喫煙に使った後の廃水は非常に有害である。また、吸い口が直接本体に付いているものは梵具︵ぼんぐ︶と呼ばれる。こちらは煙路は短い。どちらも実験器具の洗気瓶と同じ構造である。
煙管[編集]
詳細は「煙管」を参照
煙管︵キセル︶は日本、朝鮮、中国で見られる喫煙具。パイプをまねて作られた。雁首、羅宇︵らお︶、吸口から構成され、雁首の火皿に刻みたばこを詰め、着火する。本来、一息で吸いつくすもので、燻らせるものではない。日本では江戸時代の喫煙は大半がキセルによるものだった。一般的に紙巻きやパイプたばこよりも、葉の刻み方が細かい。一服あたりの平均燃焼時間は2~3分程度だが、使うタバコの葉の量は紙巻たばこの1/4程度に相当で、人によっては︵本来の喫煙法ではないが︶、紙巻きたばこの吸殻︵俗にシケモクと呼ばれる︶をこれに詰めて吸う人もいる。しかし2000年代以降、日本国内での愛用者は大幅に減少し続けている。
生産と消費[編集]

| 国 | 2010年 | 2011年 | 2012年 | 2013年 | |||||
|---|---|---|---|---|---|---|---|---|---|
| 1 | 3,004,000 t | 43,6 % | 3,157,000 t | 42,4 % | 3,126,200 t | 43,1 % | 3,148,500 t | 42,3 % | |
| 2 | 787,800 t | 11,4 % | 951,900 t | 12,8 % | 810,600 t | 11,2 % | 850,700 t | 11,4 % | |
| 3 | 690,000 t | 10,0 % | 830,000 t | 11,1 % | 820,000 t | 11,3 % | 830,000 t | 11,2 % | |
| 4 | 325,800 t | 4,7 % | 271,400 t | 3,6 % | 345,800 t | 4,8 % | 345,800 t | 4,7 % | |
| 5 | 135,700 t | 2,0 % | 214,600 t | 2,9 % | 260,800 t | 3,6 % | 260,200 t | 3,5 % | |
| 6 | 109,700 t | 1,6 % | 111,600 t | 1,5 % | 115,000 t | 1,6 % | 150,000 t | 2,0 % | |
| 7 | 172,900 t | 2,5 % | 174,900 t | 2,3 % | 72,600 t | 1,0 % | 132,800 t | 1,8 % | |
| 8 | 132,900 t | 1,9 % | 135,200 t | 1,8 % | 115,300 t | 1,6 % | 115,300 t | 1,6 % | |
| 9 | 119,300 t | 1,7 % | 102,800 t | 1,4 % | 97,900 t | 1,4 % | 108,300 t | 1,5 % | |
| 10 | 55,000 t | 0,8 % | 45,000 t | 0,6 % | 75,000 t | 1,0 % | 90,000 t | 1,2 % | |
| 11 | 60,900 t | 0,9 % | 130,000 t | 1,7 % | 120,000 t | 1,7 % | 86,400 t | 1,2 % | |
| 12 | 55,300 t | 0,8 % | 79,200 t | 1,1 % | 85,400 t | 1,2 % | 86,000 t | 1,2 % | |
| 13 | 72,000 t | 1,0 % | 79,000 t | 1,1 % | 80,000 t | 1,1 % | 80,000 t | 1,1 % | |
| 14 | 59,500 t | 0,9 % | 67,900 t | 0,9 % | 69,000 t | 1,0 % | 72,000 t | 1,0 % | |
| 15 | 59,300 t | 0,9 % | 60,300 t | 0,8 % | 61,500 t | 0,8 % | 62,000 t | 0,8 % | |
| 16 | 67,000 t | 1,0 % | 70,000 t | 0,9 % | 54,500 t | 0,8 % | 56,000 t | 0,8 % | |
| 17 | 40,500 t | 0,6 % | 44,900 t | 0,6 % | 48,100 t | 0,7 % | 53,800 t | 0,7 % | |
| 18 | 56,500 t | 0,8 % | 49,400 t | 0,7 % | 47,400 t | 0,7 % | 50,600 t | 0,7 % | |
| 19 | 89,100 t | 1,3 % | 70,100 t | 0,9 % | 50,600 t | 0,7 % | 49,800 t | 0,7 % | |
| 20 | 45,000 t | 0,7 % | 43,000 t | 0,6 % | 40,600 t | 0,6 % | 40,600 t | 0,5 % | |
| 合計 | 6,889,900 t | 100 % | 7,448,800 t | 100 % | 7,248,300 t | 100 % | 7,435,100 t | 100 % | |

生産量[編集]
たばこの原料となる葉たばこの生産量は2014年に世界で744万トンにのぼっている。最大の生産国は中国であり、2012年には314万トンが生産され、世界生産の42%を占める一大生産国となっている。以下、ブラジル、インド、アメリカ合衆国、インドネシア、ジンバブエ、マラウイ、アルゼンチン、パキスタン、トルコの順となっている。葉たばこはアフリカのいくつかの国家において重要な輸出産品となっており、なかでも世界第6位の生産量を持つジンバブエと世界第7位の生産量を持つマラウイにおいて、タバコは多大な外貨を稼ぐ最重要の輸出商品となっている。また、たばこの生産は消費の拡大に伴って増加傾向にある。
これに対し、紙巻きたばこの最大の生産国は中国であるが、以下はアメリカ、ロシア、日本、インドネシアと続き、必ずしも葉たばこ生産国が紙巻きたばこの大生産国とはなっていない。これは、消費国において葉たばこを輸入し紙巻きたばこを生産することが多いことによる。
消費量[編集]
●1900年たばこには様々な種類のものがあるが、消費の大半は紙巻きたばこによって占められている。この傾向は20世紀に入ってから急速に強まり、紙巻きたばこはたばこ消費量の8%を占めるにすぎなかった。 ●1950年には紙巻たばこの消費量は57% ●1980年代末には全たばこ消費量の80%以上が紙巻きたばこによって占められるようになった[32]。またこれに伴い、フィリップモリス︵アメリカ︶やブリティッシュ・アメリカン・タバコ︵イギリス︶、R.J.レイノルズ・タバコ・カンパニー︵アメリカ︶、インペリアル・ブランズ︵イギリス︶といった巨大なタバコ多国籍企業による市場の寡占化が進むこととなった[33]。 ●1985年に日本専売公社が民営化されて日本たばこ産業が成立すると、積極的な買収と海外進出によって規模を急速に拡大し、巨大タバコ多国籍企業の一角を占めるようになった。 ●たばこの消費は先進国においては減少を続けているが、発展途上国においては喫煙率こそ減少しているものの、その減少率は人口増加率には追い付いておらず、喫煙人口自体は増加を続けている。発展途上国の全体的な経済の底上げに伴い、喫煙を楽しむことができる程度の収入のある層が増加していることもこの増加の一因である。とくに喫煙人口増加の多い国家はインドと中国で、中国では1982年から2012年までの30年間に喫煙人口は約一億人増加した[34]。たばこ税制[編集]
たばこの販売には多くの国において古くから税がかけられており、しばしば政府の重要な収入源となっていた。特に税源の小さな開発途上国においてはたばこ税は財政上非常に重要な意味を持つものであり、1983年のハイチのように実に﹁全税収の43%がたばこからの税収であった国家﹂も存在した[32]。2013-2014年の全世界のたばこ税の税収は約2690億ドルと推定されている[35]。 日本においてもたばこ税は存在しており、国税である国たばこ税およびたばこ特別税、そして、地方税である地方たばこ税︵道府県たばこ税および市町村たばこ税︶がそれぞれかけられている。 特に先進国の各国政府が禁煙へと舵を切るのに伴い、このたばこ税はたばこ消費抑制の意図もあって各国・地域とも高額な税率をかけるようになってきている。またタバコから政府が収入を得る方法としては、税の徴収のほか専売制も広く行われた。 このたばこ専売制をもっとも大規模に行った国の一つが日本であり、1904年︵明治37年︶7月1日に大蔵省専売局︵現‥財務省・金融庁︶のもとでタバコ製造を専売として以降、1949年︵昭和24年︶に日本専売公社に改組されるなどの変遷もあったが、1985年︵昭和60年︶に民営化されて日本たばこ産業が設立されるまでの81年間にわたり日本の財政に大きな役割を果たした。参考画像[編集]
-
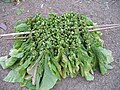 収穫されたタバコの葉
 -
 乾燥中のたばこ


脚注[編集]
(一)^ ﹁人々とたばこの関係﹂ 日本たばこ産業 2017年2月17日閲覧
(二)^ ﹁マヤ文明を知る事典﹂p217-218 青山和夫 東京堂出版 2015年11月10日初版発行
(三)^ https://www.jti.co.jp/tobacco/knowledge/society/history/world/03_1.html ﹁スペインとたばこ﹂日本たばこ産業 2017年2月17日閲覧
(四)^ ﹁タバコの世界史﹂p64-65 ジョーダン・グッドマン著 和田光弘・森脇由美子・久田由佳子訳 平凡社 1996年11月18日初版第1刷
(五)^ ﹁タバコの世界史﹂p73-74 ジョーダン・グッドマン著 和田光弘・森脇由美子・久田由佳子訳 平凡社 1996年11月18日初版第1刷
(六)^ ﹁タバコの世界史﹂p74-76 ジョーダン・グッドマン著 和田光弘・森脇由美子・久田由佳子訳 平凡社 1996年11月18日初版第1刷
(七)^ ﹃イギリス帝国の歴史――アジアから考える﹄p48 秋田茂︵中公新書, 2012年︶
(八)^ ab世界保健機関、独立行政法人国立がん研究センター・訳﹃たばこの規制に関する世界保健機関枠組条約の歴史﹄︵pdf︶︵プレスリリース︶世界保健機関。2018年2月18日閲覧。 2010 年初めまでの枠組条約の歴史。
(九)^ ﹁さまざまな喫煙形態﹂ 日本たばこ産業 2017年2月17日閲覧
(十)^ ﹁タバコの世界史﹂p99 ジョーダン・グッドマン著 和田光弘・森脇由美子・久田由佳子訳 平凡社 1996年11月18日初版第1刷
(11)^ ﹁タバコの世界史﹂p121 ジョーダン・グッドマン著 和田光弘・森脇由美子・久田由佳子訳 平凡社 1996年11月18日初版第1刷
(12)^ ﹁タバコの歴史﹂p147 上野堅實 大修館書店 1998年2月1日初版発行
(13)^ ﹁タバコの世界史﹂p125 ジョーダン・グッドマン著 和田光弘・森脇由美子・久田由佳子訳 平凡社 1996年11月18日初版第1刷
(14)^ ﹁タバコの歴史﹂p151 上野堅實 大修館書店 1998年2月1日初版発行
(15)^ ﹁タバコの歴史﹂p162 上野堅實 大修館書店 1998年2月1日初版発行
(16)^ ﹁ビジュアル版 世界有用植物誌 人類の暮らしを変えた驚異の植物﹂p152 ヘレン&ウィリアム・バイナム著 栗山節子訳 柊風舎 2015年9月22日第1刷
(17)^ Sweanor, David; Nutt, David J.; Phillips, Lawrence D.; Balfour, David; Curran, H. Valerie; Dockrell, Martin; Foulds, Jonathan; Fagerstrom, Karl et al. (2014). “Estimating the Harms of Nicotine-Containing Products Using the MCDA Approach”. European Addiction Research 20 (5): 218-225. doi:10.1159/000360220. PMID 24714502.
(18)^ White, C. (2002). “Tobacco industry knowingly duped public with "low tar" brands”. BMJ 324 (7338): 633. doi:10.1136/bmj.324.7338.633.
(19)^ United States Department of Health and Human Services, Public Health Service, National Institutes of Health, National Cancer Institute 2011, pp. 1–12.
(20)^ “喫煙女性の健康リスク激増、﹁軽い﹂タバコが一因か” (2013年1月25日). 2016年8月25日閲覧。
(21)^ Thun, Michael J.; Carter, Brian D.; Feskanich, Diane; Freedman, Neal D.; Prentice, Ross; Lopez, Alan D.; Hartge, Patricia; Gapstur, Susan M. (2013). “50-Year Trends in Smoking-Related Mortality in the United States”. New England Journal of Medicine 368 (4): 351-364. doi:10.1056/NEJMsa1211127. PMC 3632080. PMID 23343064.
(22)^ House of Commons Debates - 16 December 2015 : Column 1548. House of Commons Debates 16 December 2015. Vol. 603. 16 December 2015.
(23)^ コロンビア大学嗜癖物質乱用国立センター (2012-06). Addiction Medicine: Closing the Gap between Science and Practice. p. 56, 60-61
(24)^ https://www.sankei.com/article/20150901-2OY3YRCQRVLWLPQ2LGRUCUYS7A/ ﹁酒・たばこ18歳解禁を 自民特命委、選挙権年齢下げ踏まえ提言﹂産経新聞 2015年9月1日 2017年2月18日閲覧
(25)^ ﹁たばこに続く道 たばこ 文化 人生﹂p2 大川俊博 有斐閣 1991年12月30日初版第1刷
(26)^ “国際郵便を利用したたばこの個人輸入について : 税関 Japan Customs”. www.customs.go.jp. 2019年7月1日閲覧。
(27)^ なぜプロ野球選手は﹁タバコ﹂がやめられないのか? (4/4) Business Media 誠 2013年3月7日
(28)^ David Brown (2010-10-09), Tony Gwynn suspects his cancer comes from chewing tobacco, Yahoo!Sports (英語), 2010年10月11日閲覧
(29)^ http://espn.go.com/boston/mlb/story/_/id/11380584/curt-schilling-former-boston-red-sox-pitcher-says-chewing-tobacco-led-mouth-cancer
(30)^ 川床邦夫﹃中国たばこの世界﹄<東方選書> 東方書店 1999年、ISBN 9784497995681 pp.187-202.
(31)^ "FAOSTAT". faostat3.fao.org. 3 November 2016.
{{cite web}}: Cite webテンプレートでは|access-date=引数が必須です。 (説明)
(32)^ ab﹁タバコの世界史﹂p131 ジョーダン・グッドマン著 和田光弘・森脇由美子・久田由佳子訳 平凡社 1996年11月18日初版第1刷
(33)^ ﹁タバコの歴史﹂p232-233 上野堅實 大修館書店 1998年2月1日初版発行
(34)^ https://www.afpbb.com/articles/-/3026294 ﹁たばこの健康被害、アジア地域でまん延﹂AFPBB 2014年09月18日 2017年2月16日閲覧
(35)^ https://jp.reuters.com/article/health-tobacco-idJPKBN14U0C7/ ﹁喫煙による死者数、2030年までに年800万人に増加へ﹂ロイター 2017年1月11日 2017年2月16日閲覧
関連項目[編集]
- タイトルに「たばこ」を含むページの一覧
- タイトルに「タバコ」を含むページの一覧
- タイトルに「煙草」を含むページの一覧
- たばこの銘柄一覧
- 日本における禁煙治療薬および禁煙用のたばこ代替品の一覧
- たばこの添加物の一覧
- 煙草屋
外部リンク[編集]
- たばこと健康に関する情報ページ - 厚生労働省
- たばこの歴史と文化 - たばこと塩の博物館
- たばこの基礎知識 - JT
- たばこ添加物リスト - JT
- タバコ - MSDマニュアル
- 『タバコ(煙草)』 - コトバンク
- 『煙草』 - コトバンク
| 総論 |
| ||||||
|---|---|---|---|---|---|---|---|
| 品種 |
| ||||||
| スタイル |
| ||||||
| 健康への影響 |
| ||||||
| 禁煙 |
| ||||||
| 社会 |
| ||||||
| 規制 |
| ||||||
| 各国・地域 |
| ||||||
| 宗教 |
| ||||||
| たばこメーカー |
| ||||||
| その他 |
| ||||||
| 国立図書館 |
|
|---|---|
| その他 |
|